Australia


Chart of the week
The shift in US policy rate expectations by year end
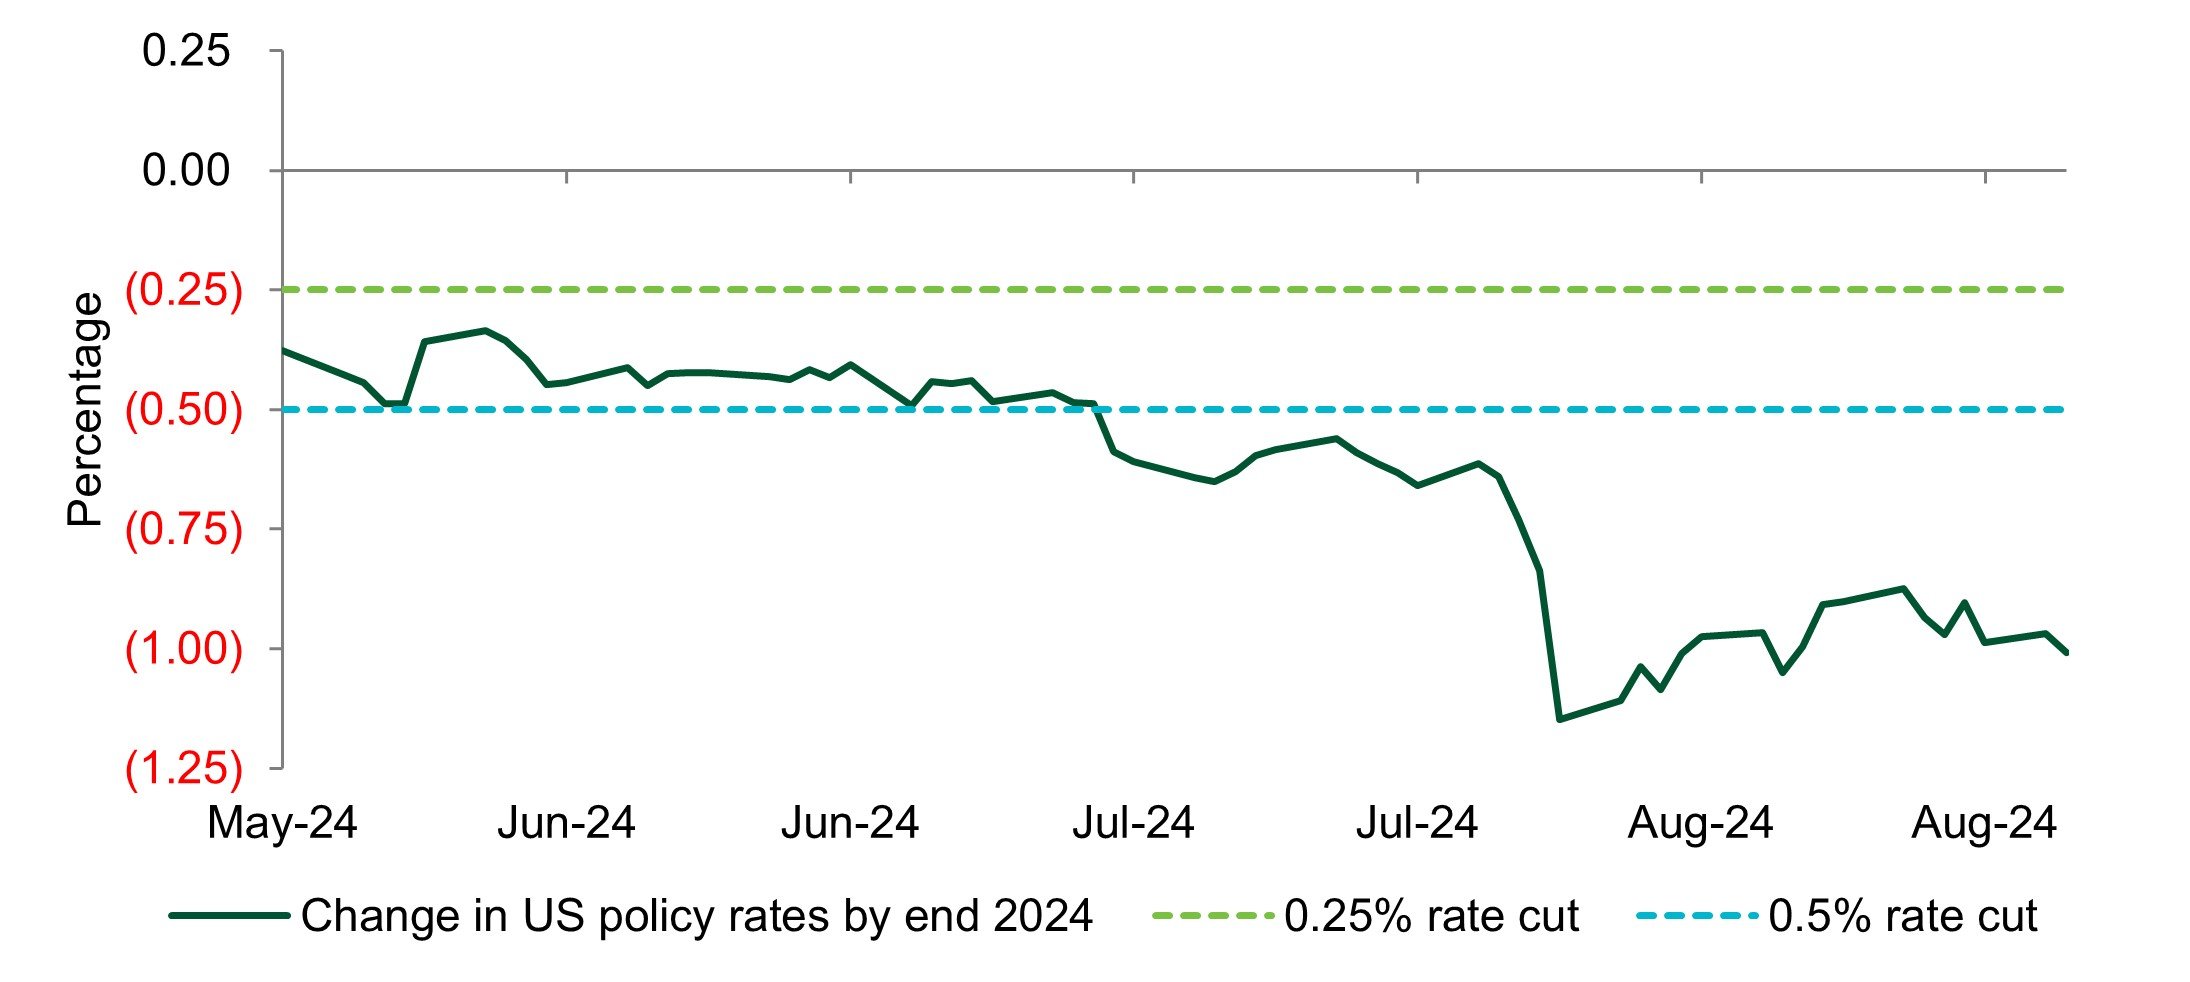
Source: Insight Investment and Bloomberg as at 28 August 2024.
- Market implied US policy rate expectations continue to build in a 100bp reduction in rates by the end of 2024; this is double the magnitude expected in June. The big question is whether September’s cut will be a 25bp or 50bp move, with markets tilting towards the former. Either way, the start of the easing cycle should help to support risk assets, and we remain constructive for now.
Market watch
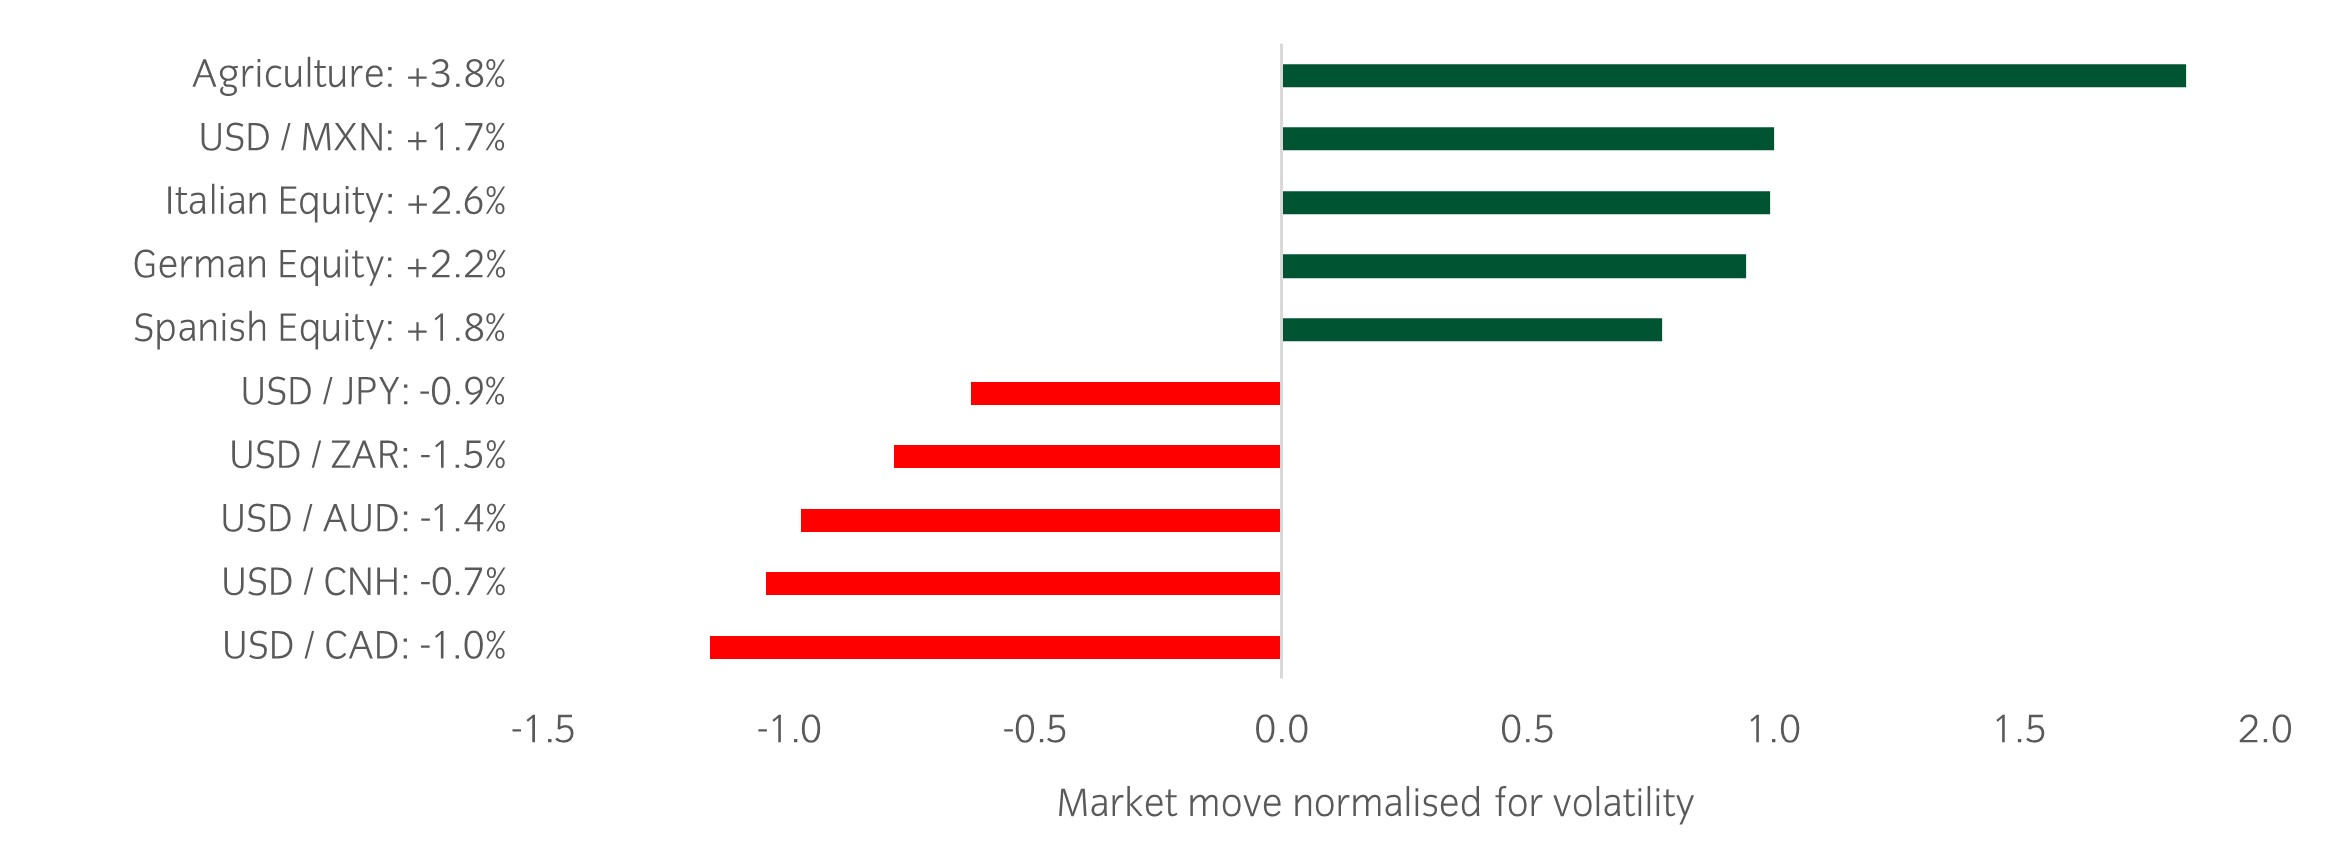
Source: Bloomberg and Insight as at 30 August 2024. The price movement of each asset is shown next to its name. The data used by the bar chart divides the price movement by the annualised historical volatility of each asset.
Over the past week, several things caught our eye:
- European inflation data has given further encouragement to the ECB to continue cutting rates. Below consensus CPI data for Germany and Spain on Thursday pre-empted Eurozone year-on-year CPI coming in at 2.2%, down from 2.6% in July and closing in on the ECB’s 2% target.
- US growth data showed signs of resilience following the scare in early August. 2nd quarter GDP data was revised up from 2.8% to 3% while an in line initial jobless claim number brought the four-week moving average down to its lowest level in two months.
- Nvidia delivered a strong set of second quarter earnings, beating estimates on both sales and profits. Forward guidance, however, did not live up to high market expectations and as a result the stock closed down 6% on Thursday.
Winners & losers: European equities trended higher over the week while the dollar weakened against more cyclically sensitive currencies.
Asset allocation observation
Nvidia earnings keeping pace with share price growth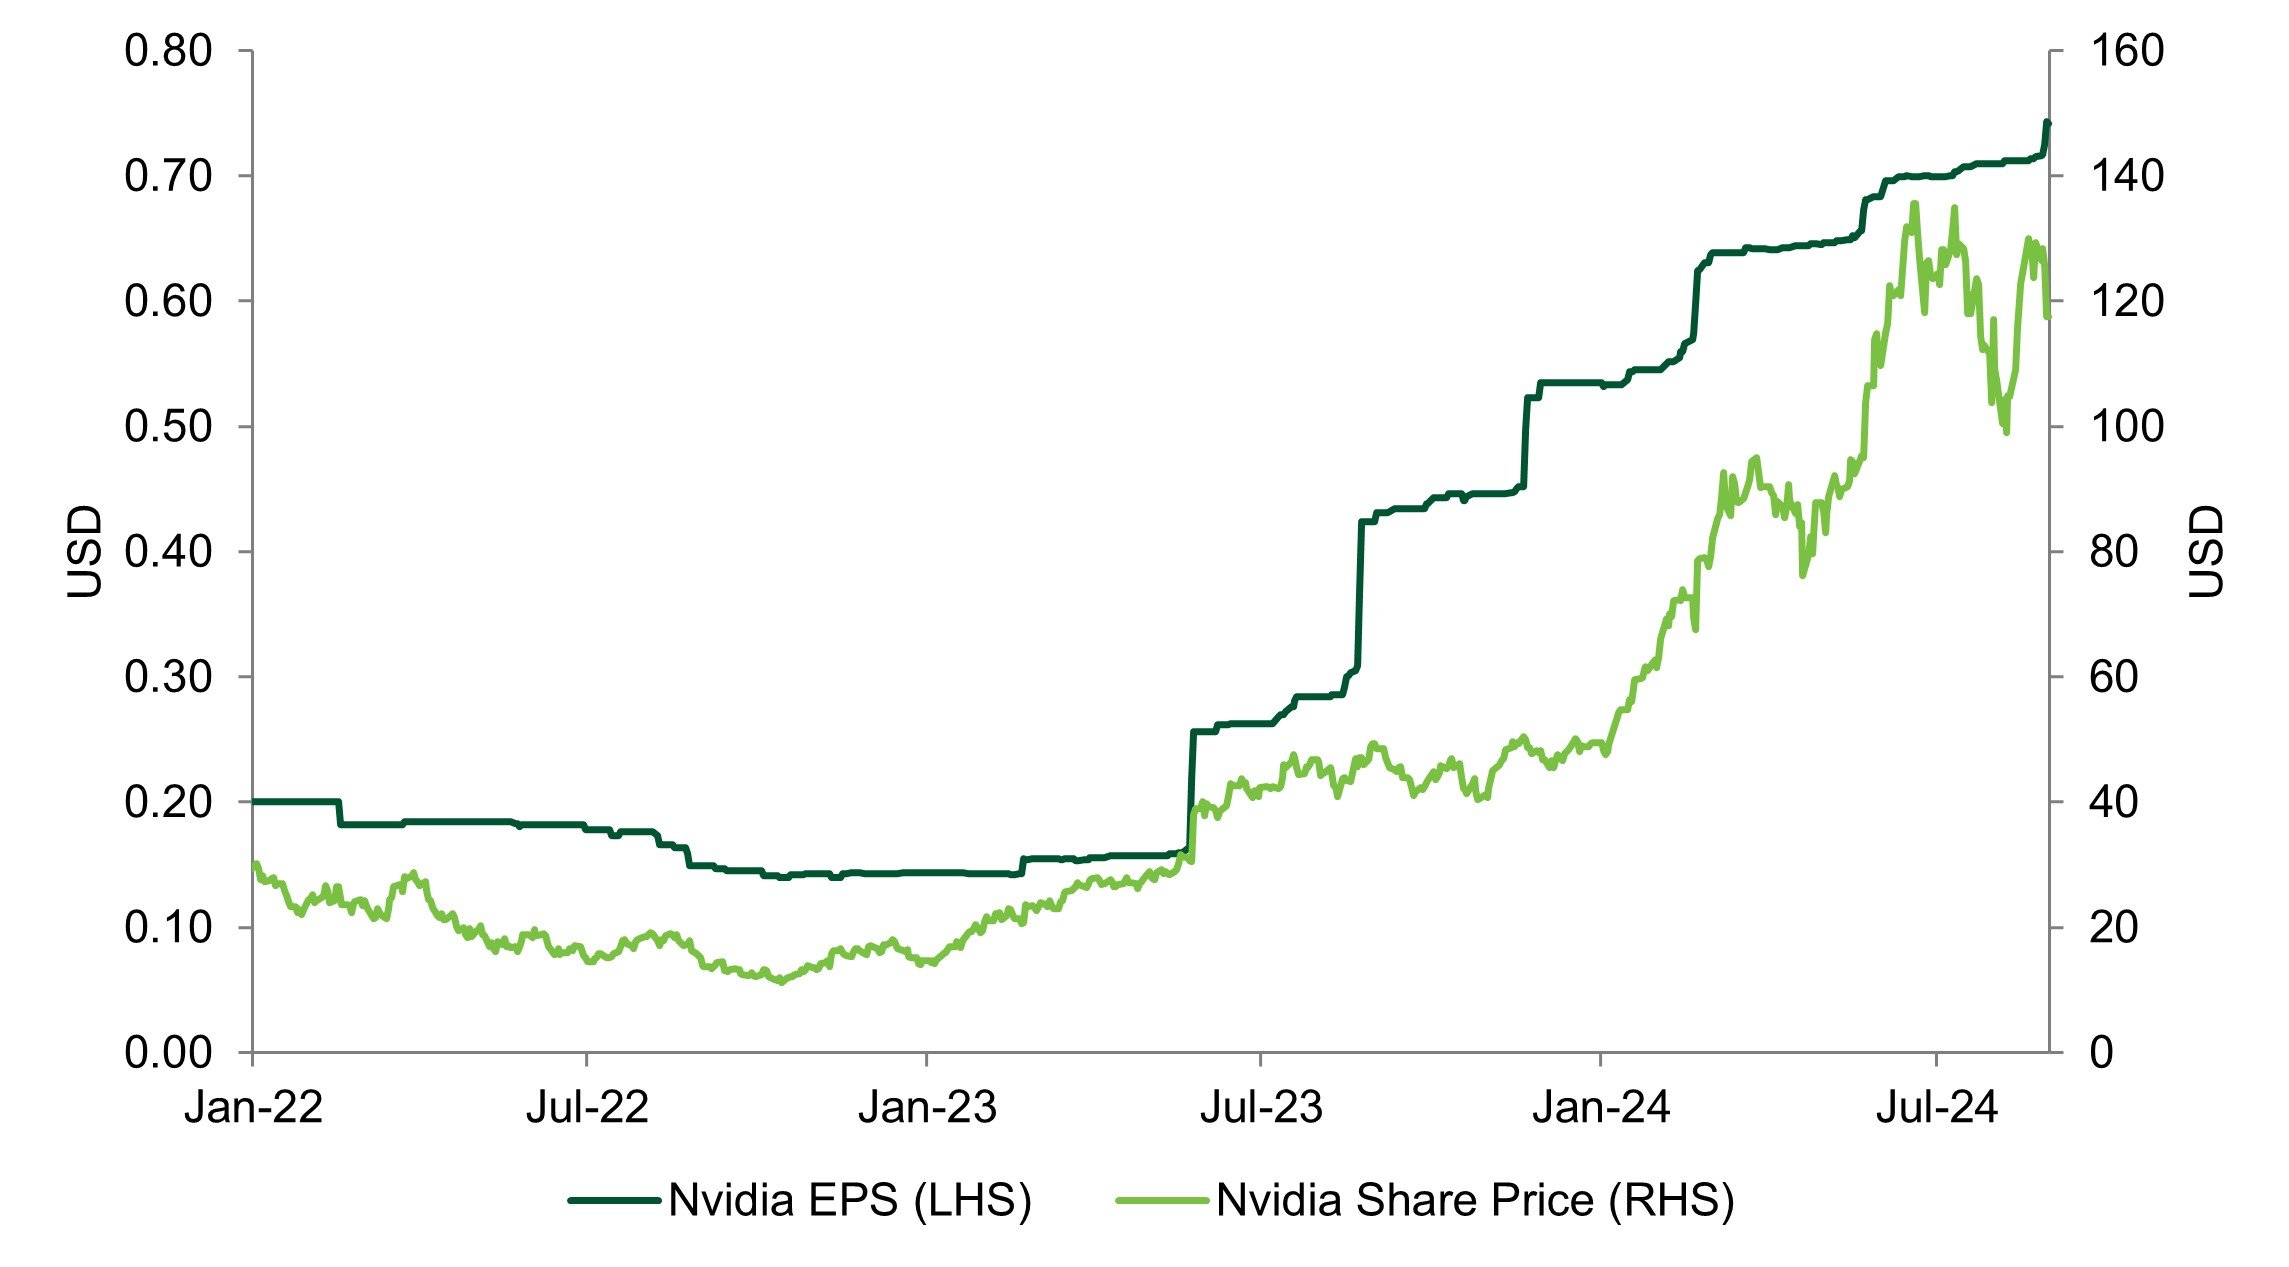
Source: Insight and Bloomberg as at 23 August 2024.
- Nividia has been the most important stock of 2024, driving a quarter of all gains in the S&P 500. Interestingly, the >150% year-to-date return has been matched by a significant growth in earnings. The pace of growth, however, has been steadily slowing and the company's most recent forward guidance disappointed investors.
- We have previously flagged that as the incredible earnings growth of megacap earnings over the last year fades, we will need to see the rest of the market pick up the slack for the equity rally to continue. For now we remain close to our long term neutral equity weight, conscious of the evenly balanced risks to growth.
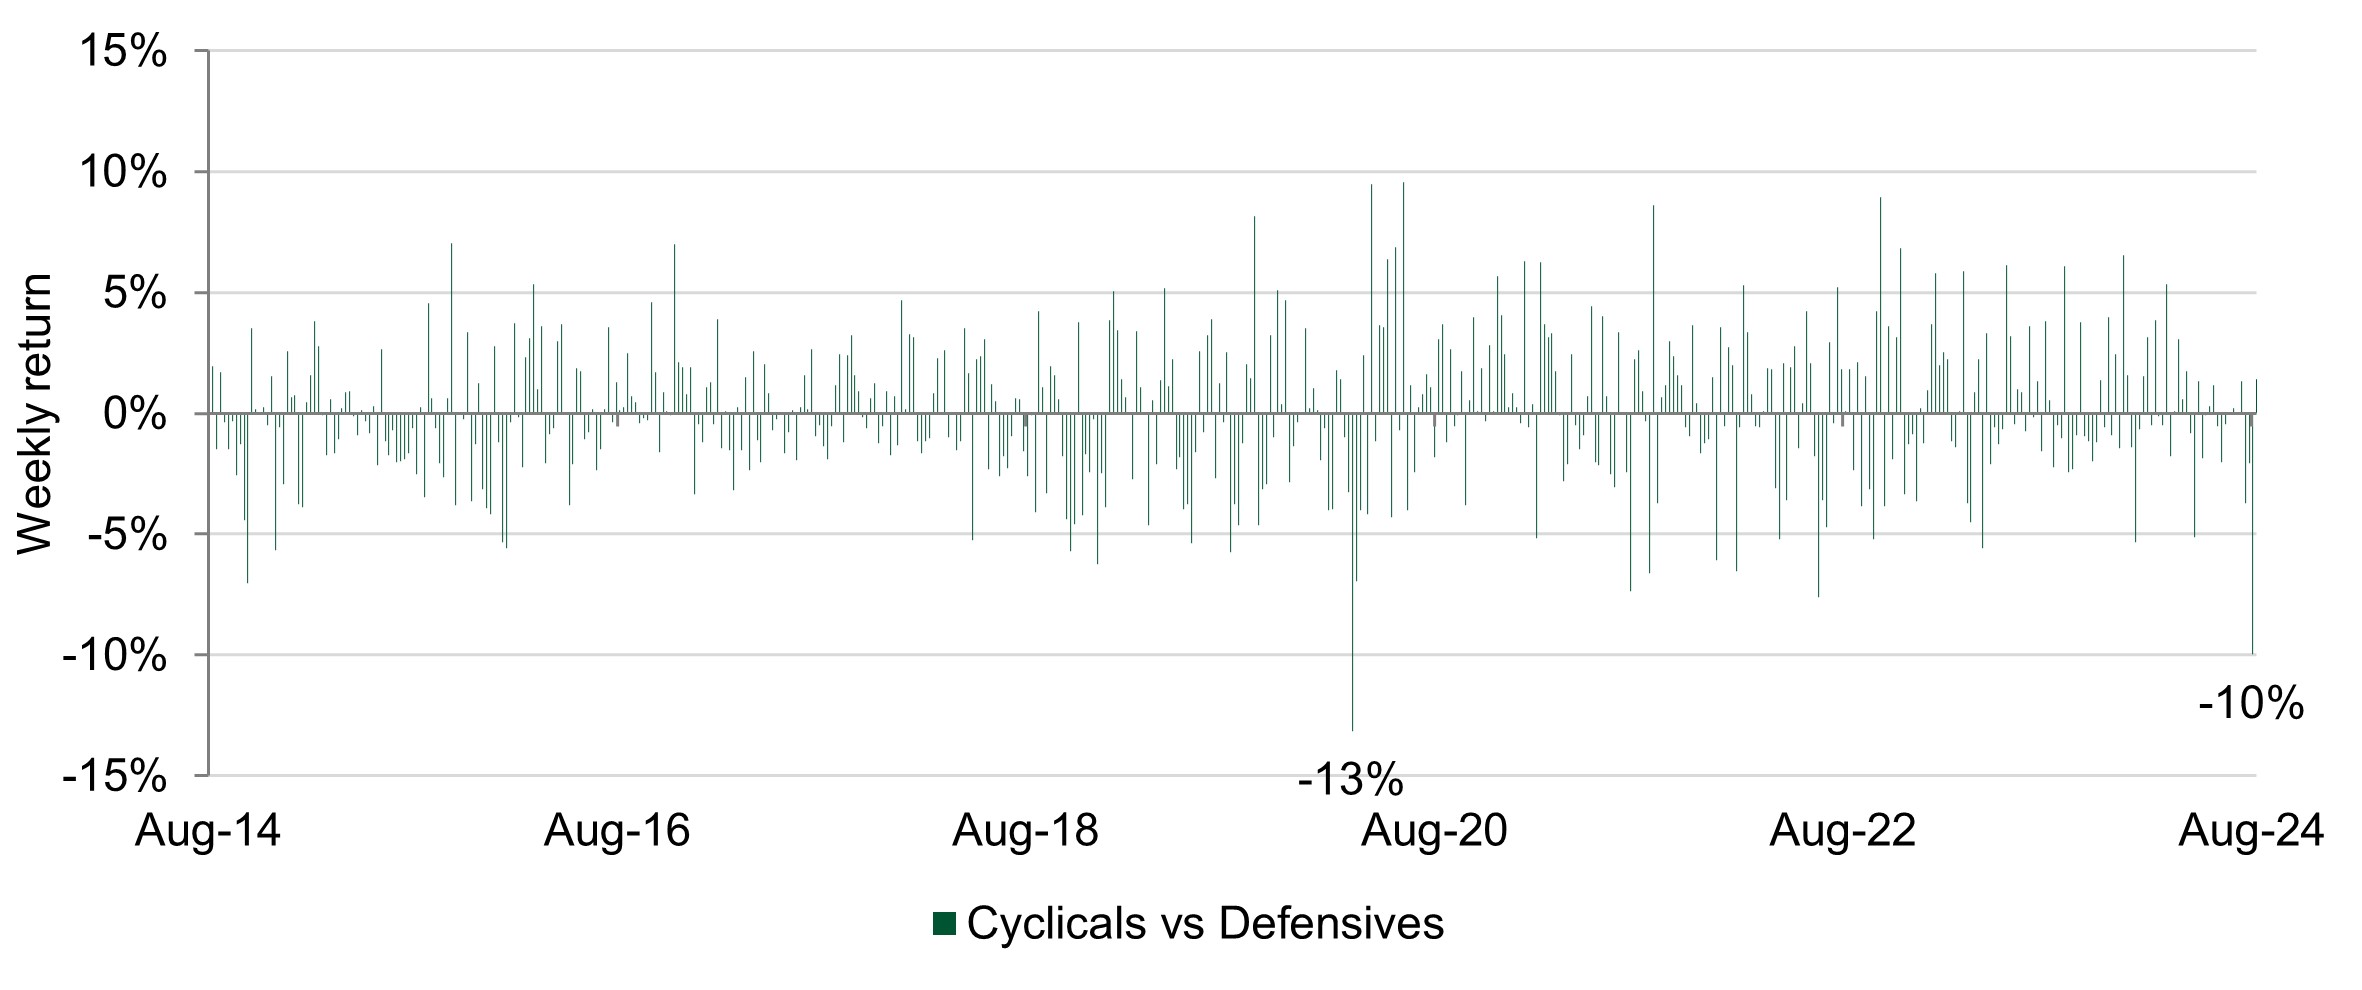
Chart of the week
Defensive stocks have steadily rallied during recent market turbulence
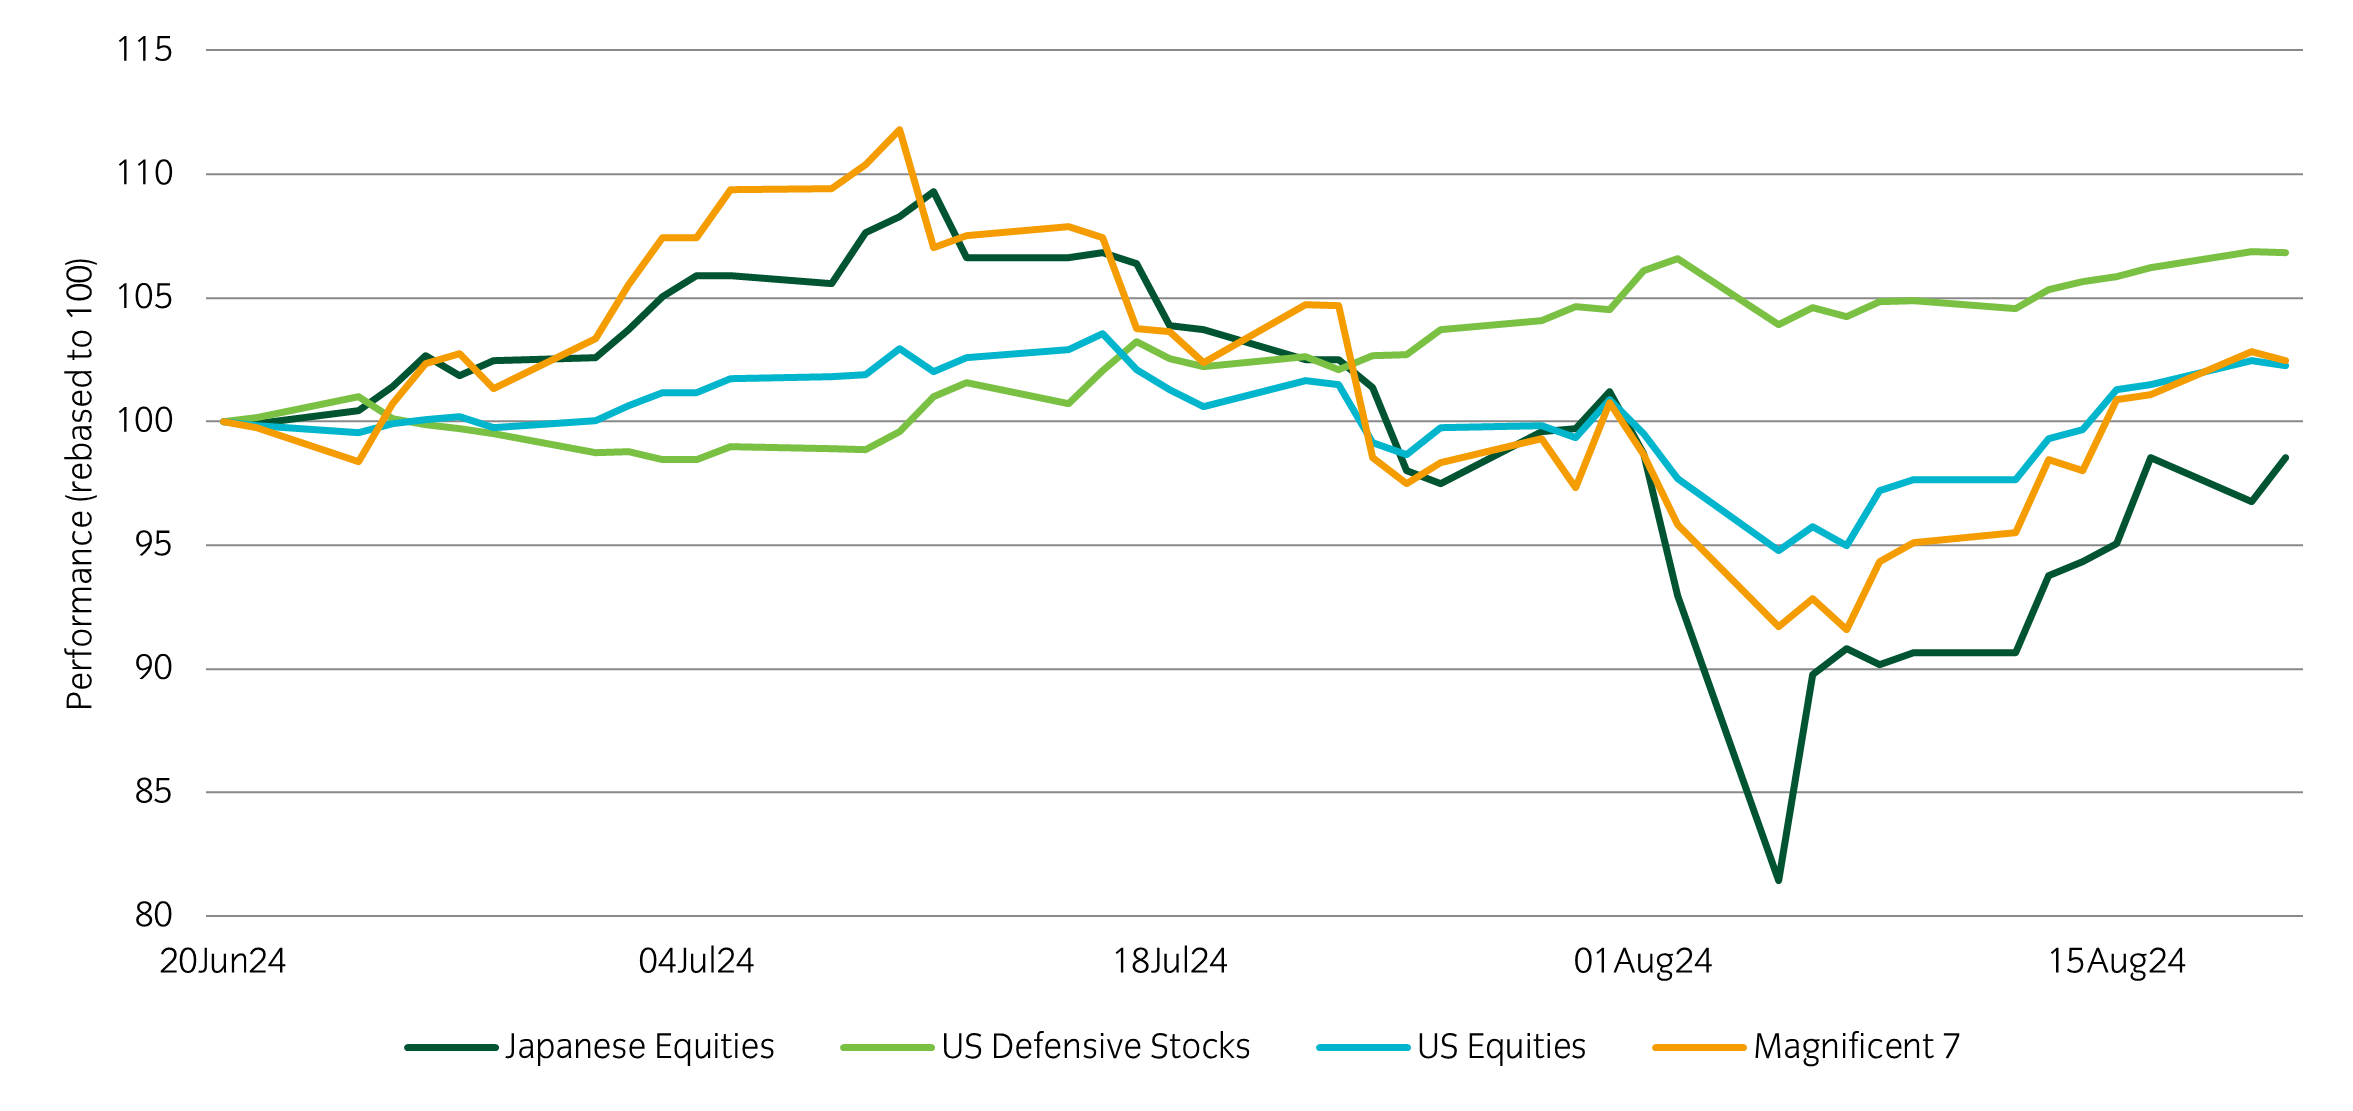
Source: Insight Investment and Bloomberg as at 20 August 2024.
- Many equity indices hit all-time highs around the middle of July. The rally was particularly strong for Japanese equities and the “Magnificent 7” (Apple, Amazon, Google, Meta, Microsoft, Nvidia and Tesla). However, some weak US labour market data, a sharp appreciation in the Japanese yen and a negative reaction to earnings reports from the Magnificent 7 triggered a change in market direction, with the sell off particularly pronounced in previous winners. Over the past couple of weeks, some better-than-expected US growth and inflation data has helped support a strong rebound. Throughout this turbulence, US defensive stocks have steadily rallied, which reflects the increased uncertainty over the economic outlook
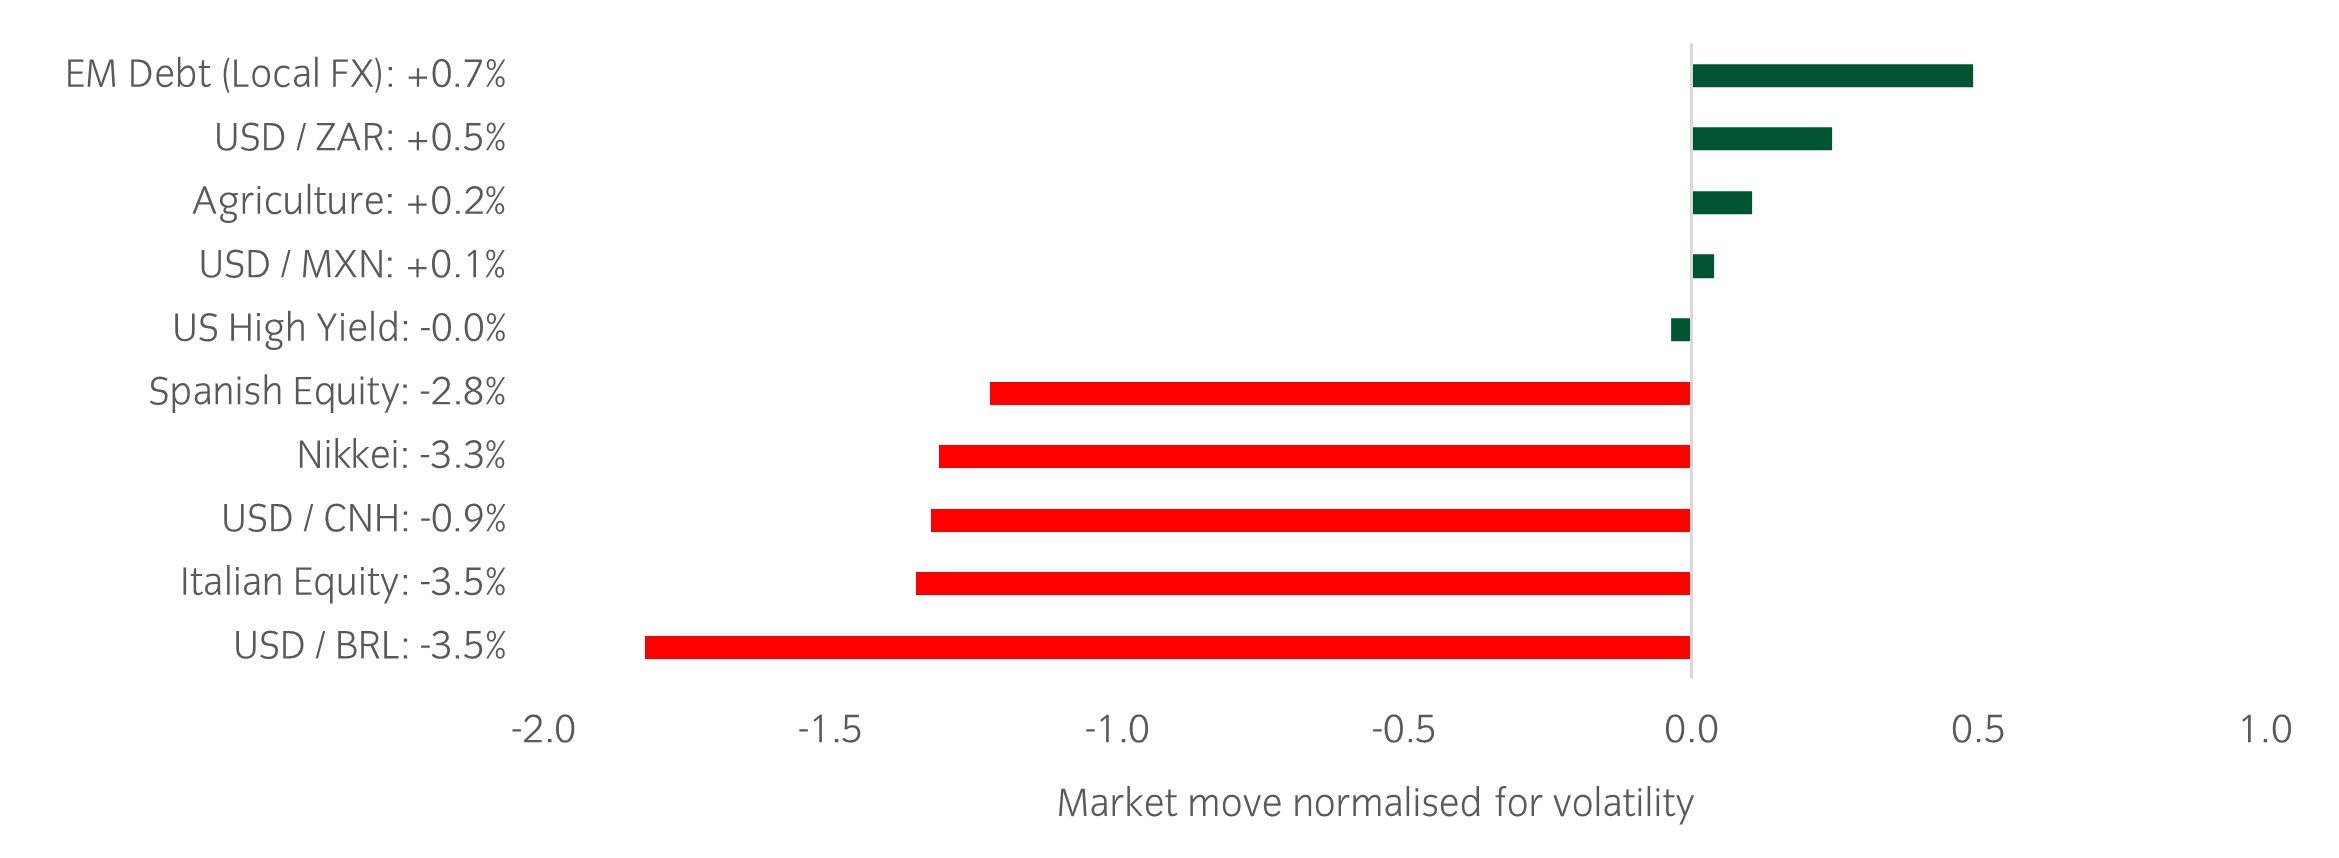
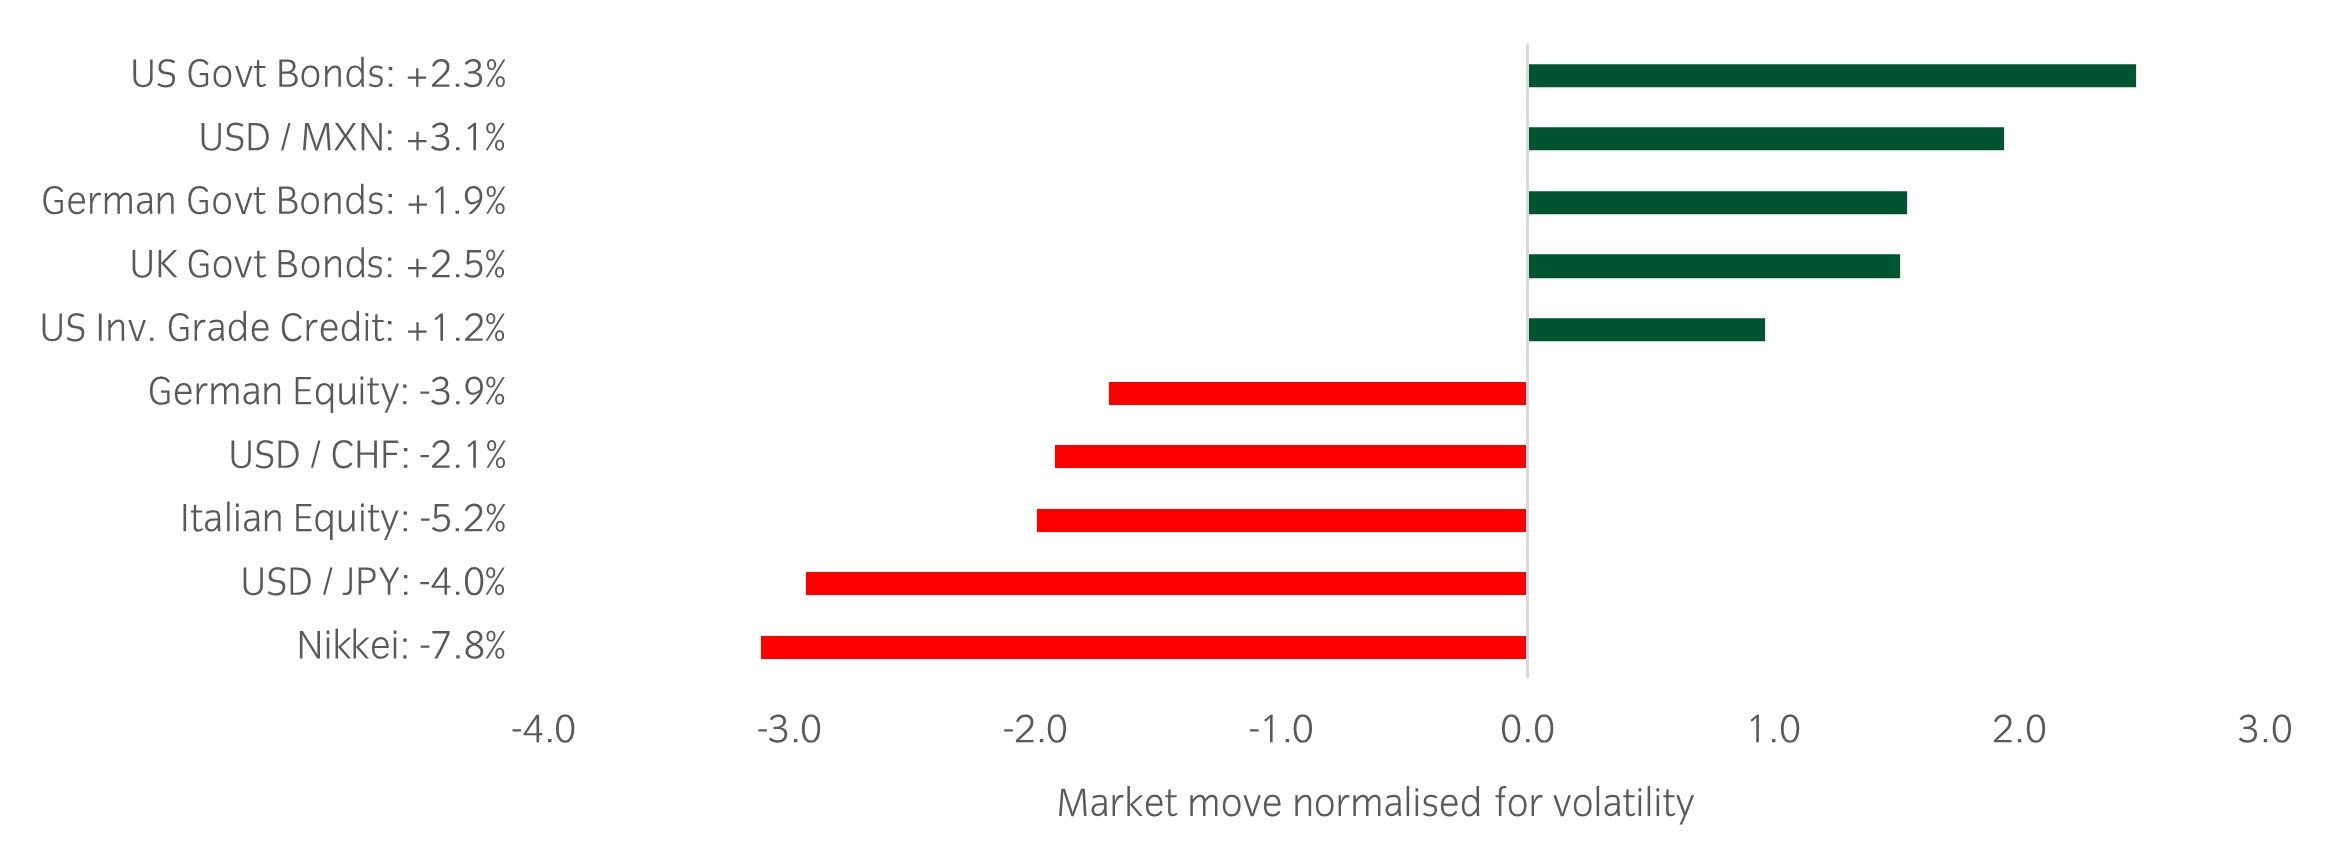
Market watch
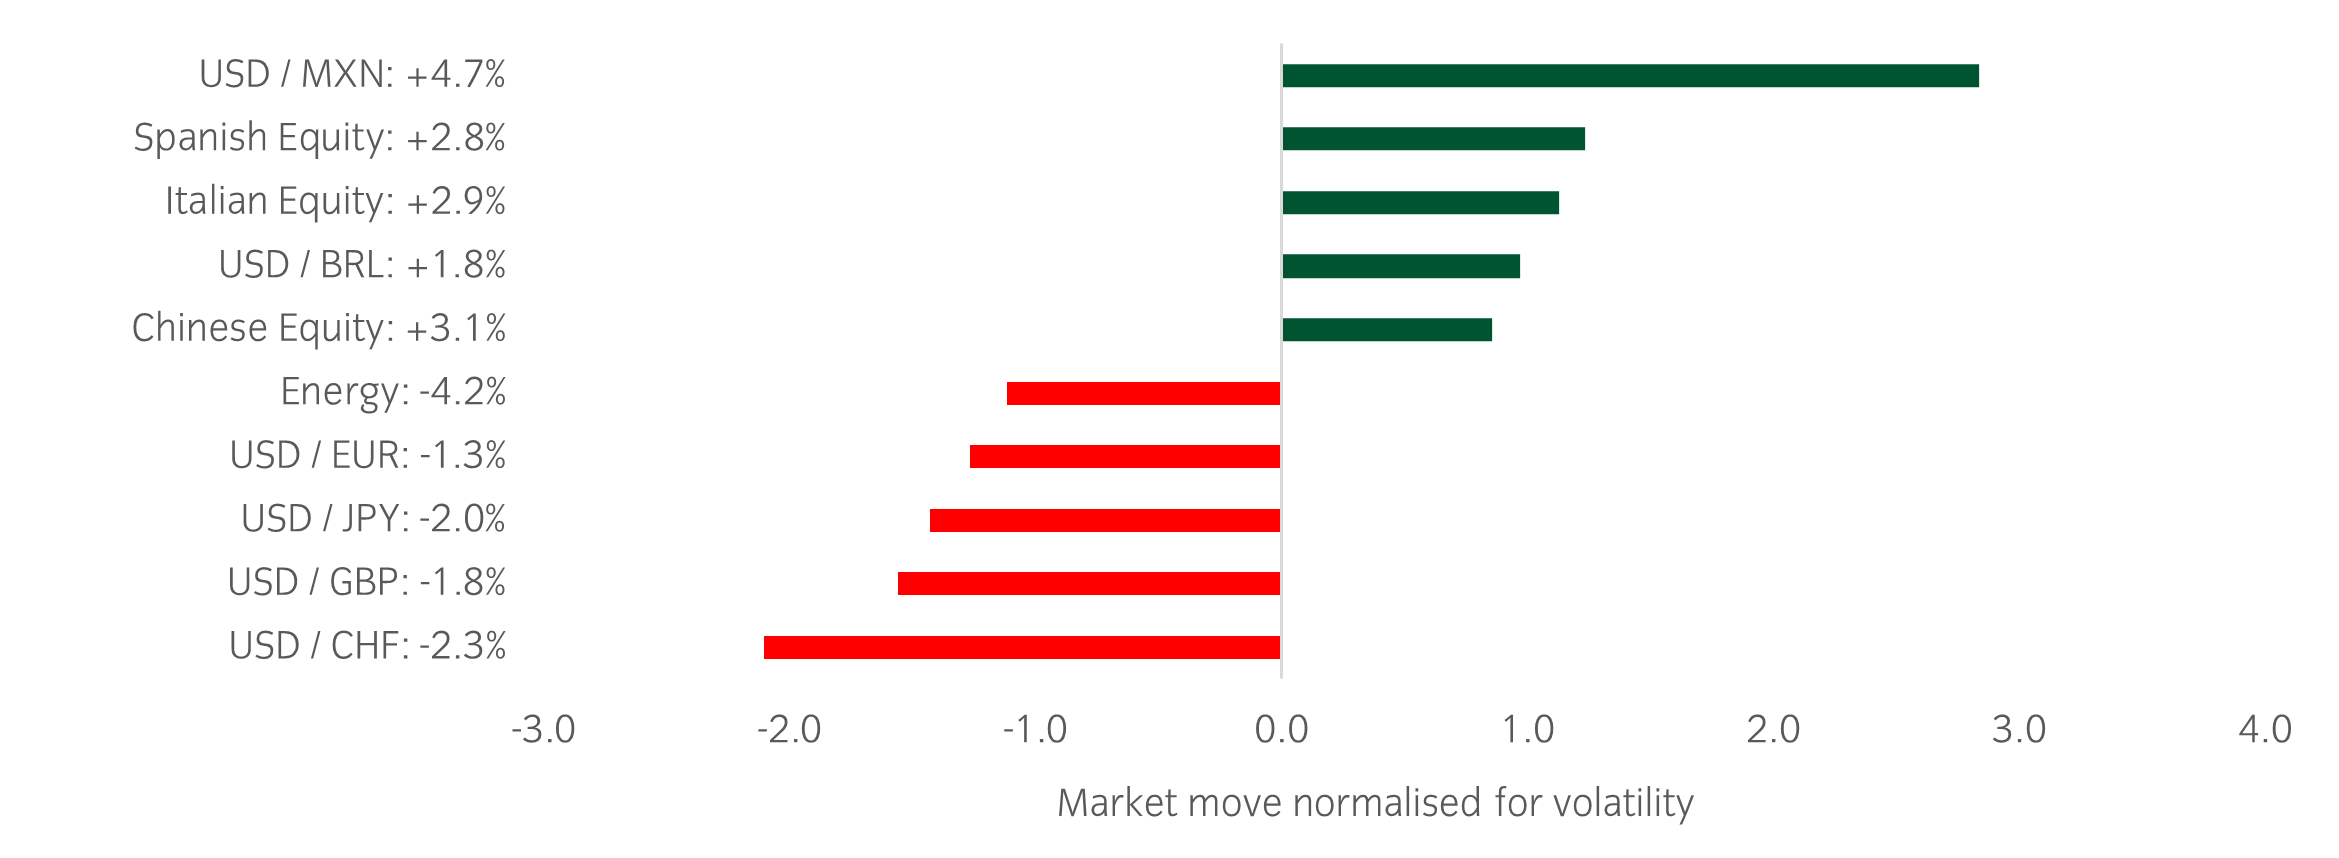
Source: Bloomberg and Insight as at 23 August 2024.The price movement of each asset is shown next to its name. The data used by the bar chart divides the price movement by the annualised historical volatility of each asset.
Over the past week, several things caught our eye:
- In the US, economic data in aggregate came in better than expected, including stronger provisional August composite PMIs and increasing existing home sales. The data contributed to lowering market expectations for a 0.5% rate cut in September. Market focus will move to Fed Chair Powell’s Jackson Hole speech on Friday.
- In Asia, Japanese yen appreciated, and the Japanese government bond yields moved higher, after Bank of Japan Governor Ueda reiterated plans to reduce monetary policy easing.
- Following on from the Paris Olympics, Euro area provisional services PMIs came in notably higher with support from France. European equities saw a noticeable advance with the help of stronger EUR and weaker USD. We remain constructive on Europe assets.
Winners & losers: The dollar depreciated against major developed currencies, however it remained strong against the Mexican Peso.
Asset allocation observation
VIX AND S&P 500 moves – 1 week move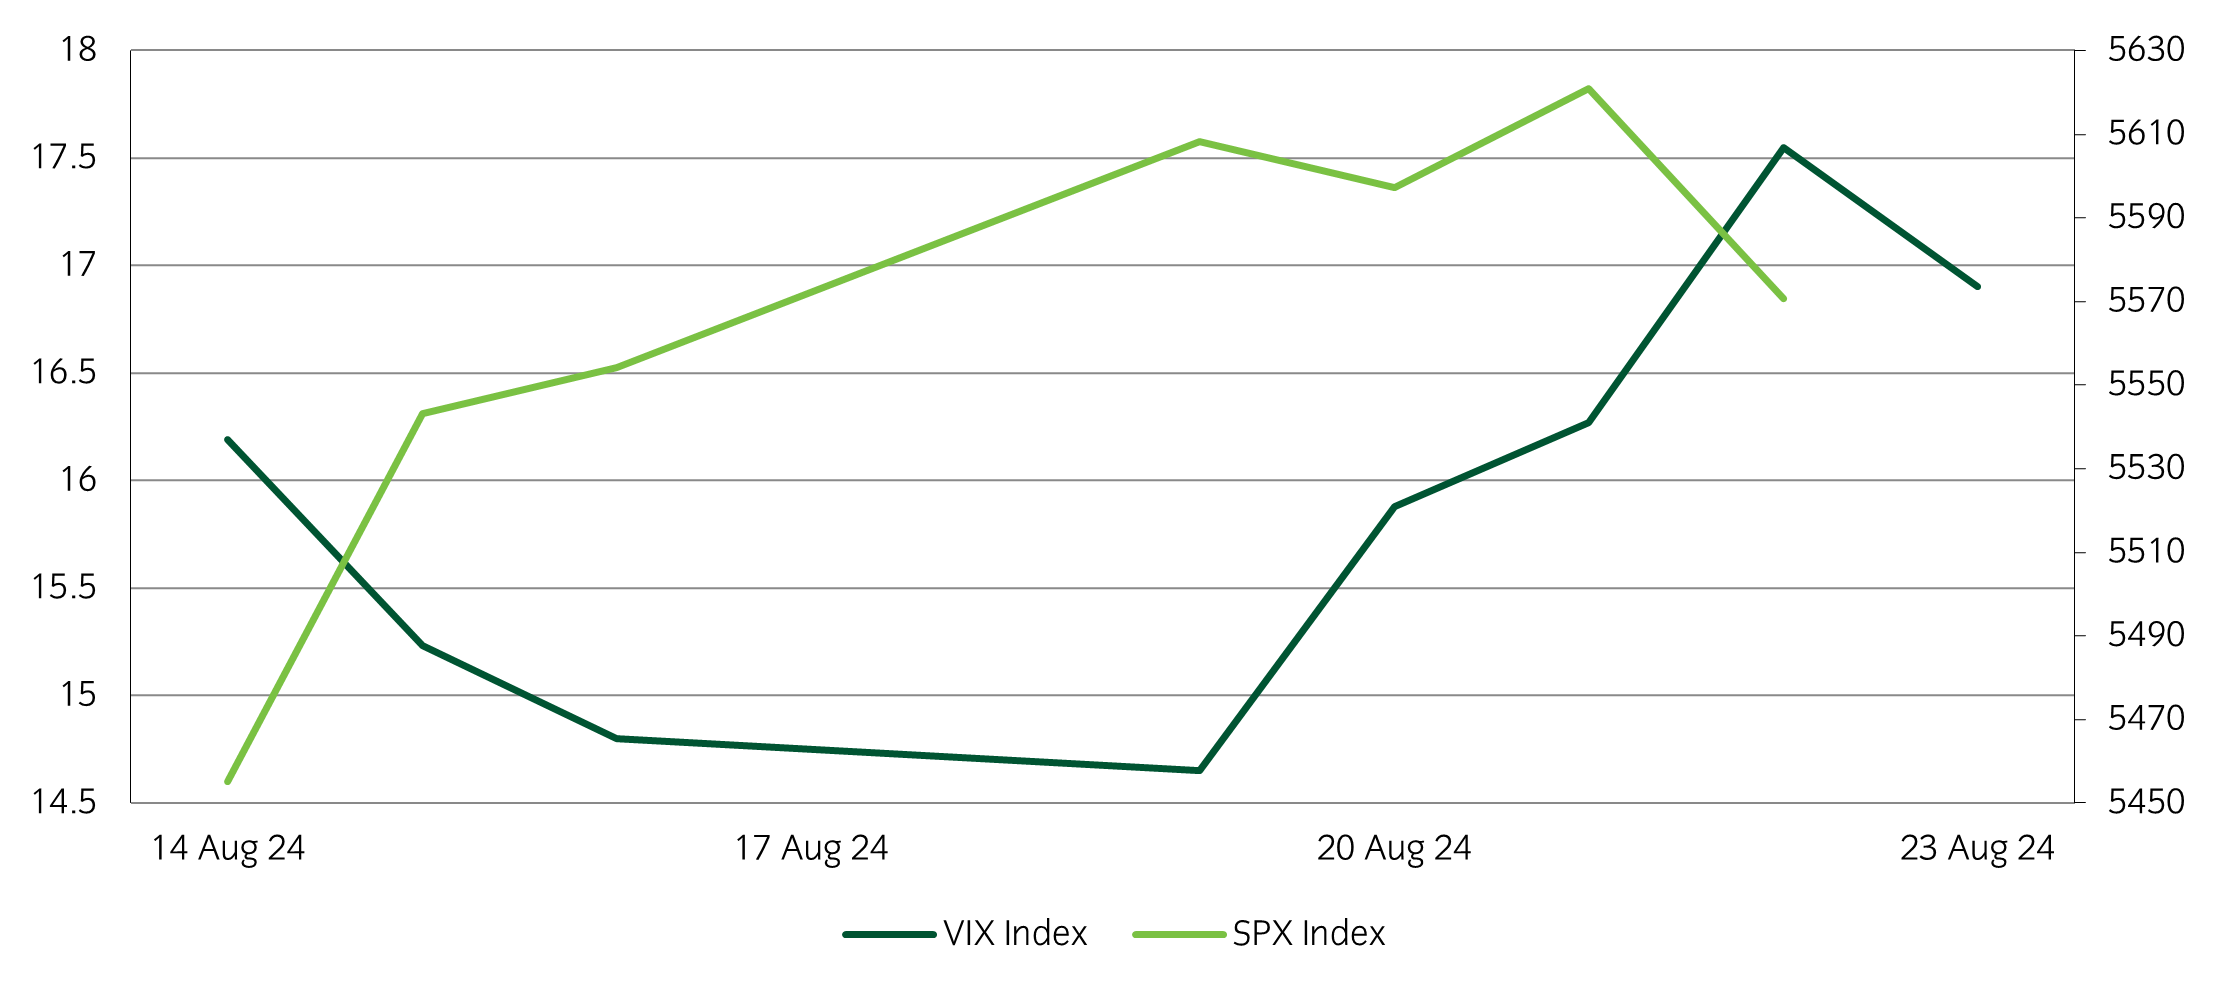
Source: Insight and Bloomberg as at 23 August 2024.
- Equity markets have rebounded strongly from the draw-downs experienced earlier in August due in part to receding concerns of a slowdown in economic growth. Periods of strong equity market rebound typically coincide with a fall in volatility. It is interesting to note that volatility remains relatively elevated, which may indicate lingering market uncertainties with growth outlook.
Chart of the week
Japanese assets at the heart of cross-asset volatility spike
Source: Insight Investment and Bloomberg as at 14 August 2024.
- The cross-asset volatility spike that we experienced in early August had its roots in a fundamental reassessment of growth but was likely exacerbated by the unwinding of large momentum and carry trades. Japanese assets were hit with a perfect storm, being highly sensitive to all three ‘risk off’ drivers: global growth concerns; JPY carry trade unwind; AI & Semiconductor stocks correction.
- Given the strong performance in recent years, it is likely that large systematic positions had been built up in both long Japanese equities & short JPY trades. Hence, the unwinding of both at the same time led to a pick-up in volatility that overshot the economic reality.
Market watch
Source: Bloomberg and Insight as at 16 August 2024. The price movement of each asset is shown next to its name. The data used by the bar chart divides the price movement by the annualised historical volatility of each asset.
Over the past week, several things caught our eye:
- In the US, an upward surprise to July US retail sales, following a relatively mild inflation report, indicates strong ongoing momentum in real consumer spending as the third quarter begins, despite the indication of normalization in US labour demand. Consequently, US equities rallied after clearing consumer hurdles.
- As the Q2 earnings season has come to its final stages, 90% of companies have reported in the US and in Europe. Companies have delivered the usual beats, where EPS growth came in better than initially expected, at +8% YoY in the US and at +1% YoY in Europe, which implied an EPS surprise factor of 4% and 3%, respectively.
- On the other side of the world, Japanese stocks had a subsequent +21% bounce-back after the second worst one-day drop (-12.4%) since 1987. The return pattern is similar to the story in 1987 during which Nikkei 225 dropped 14.9% on the 20 of October 1987 then recovered +9.3% in the next day. Given the moves have likely been exacerbated by systematic selling with both domestic (Bank of Japan rates hike) and global uncertainties (US recession risk, currency carry trades unwind, AI & semiconductor stocks correction) rather than earnings or macroeconomic data, we remain constructive on Japan.
Winners & losers: Global equities have shown a strong bounce back from the big move lower last week, with Asia Pacific equities leading.
Asset allocation observation
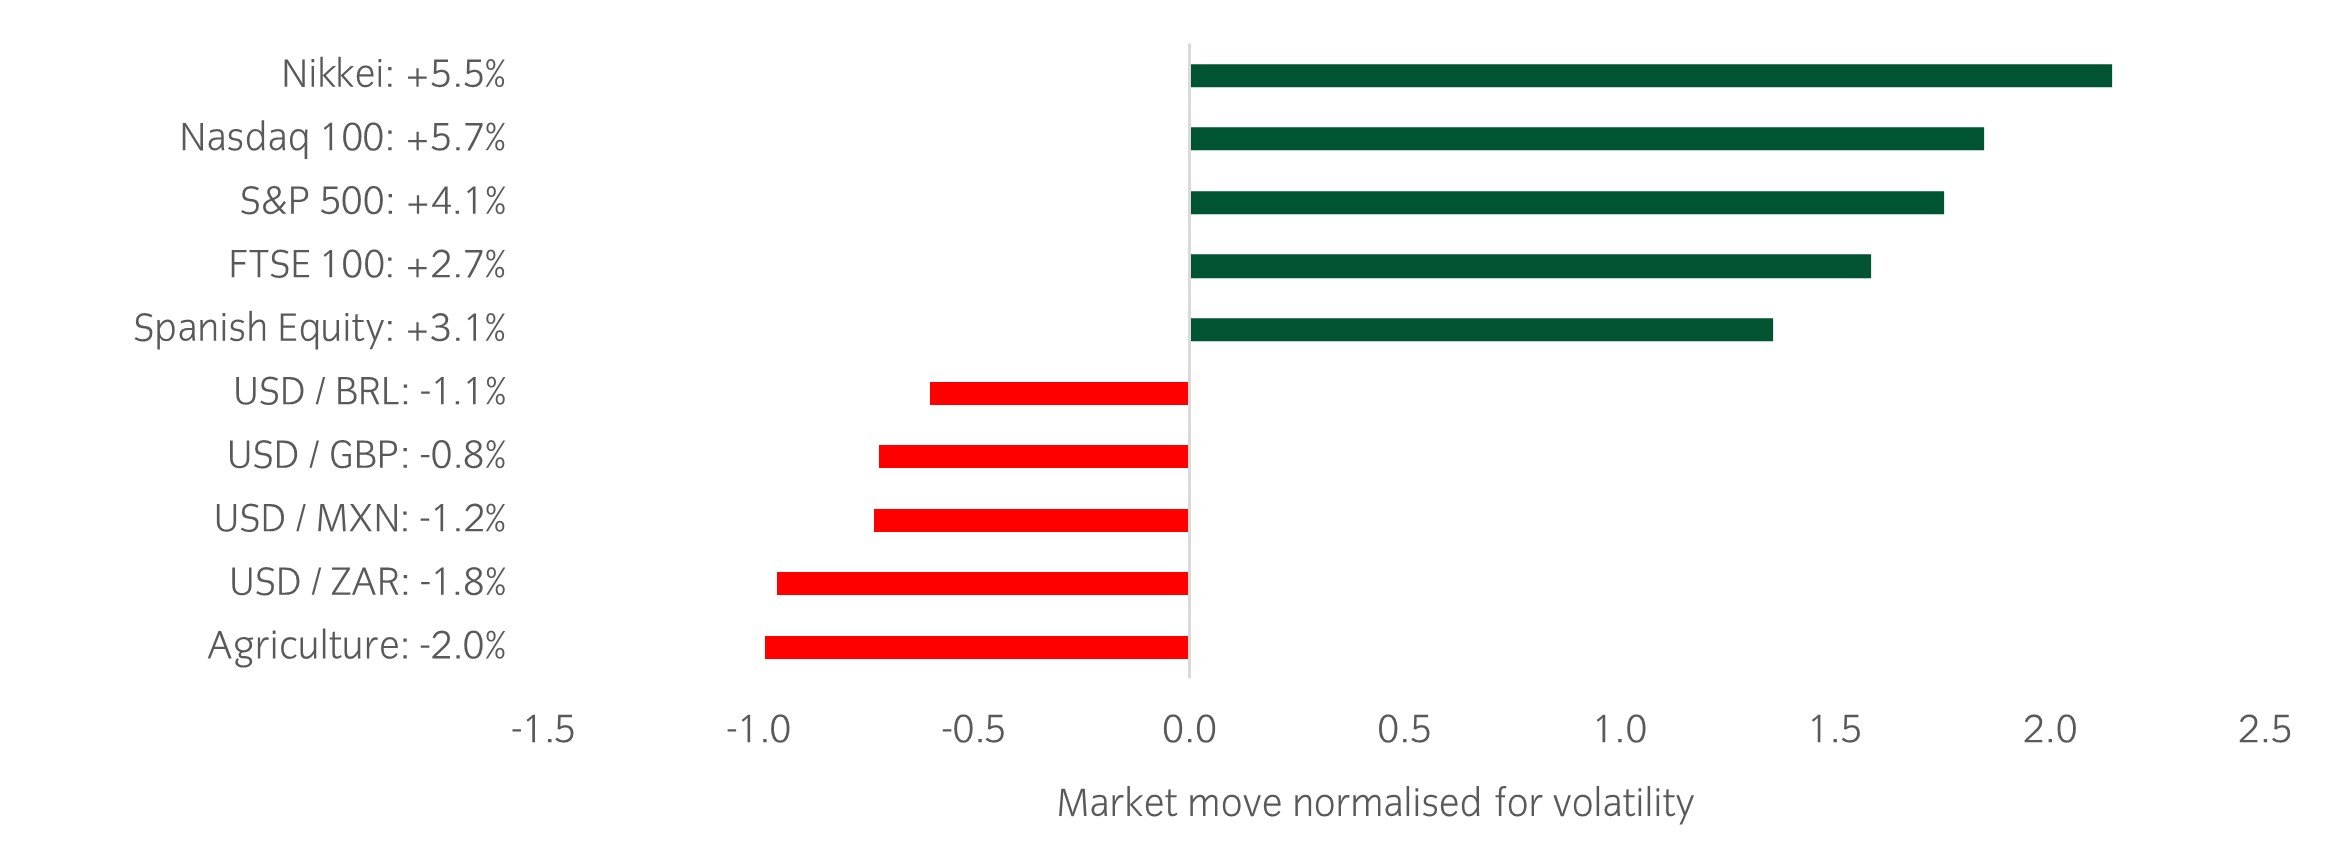
Top 5 & Bottom 5 price move since 5th August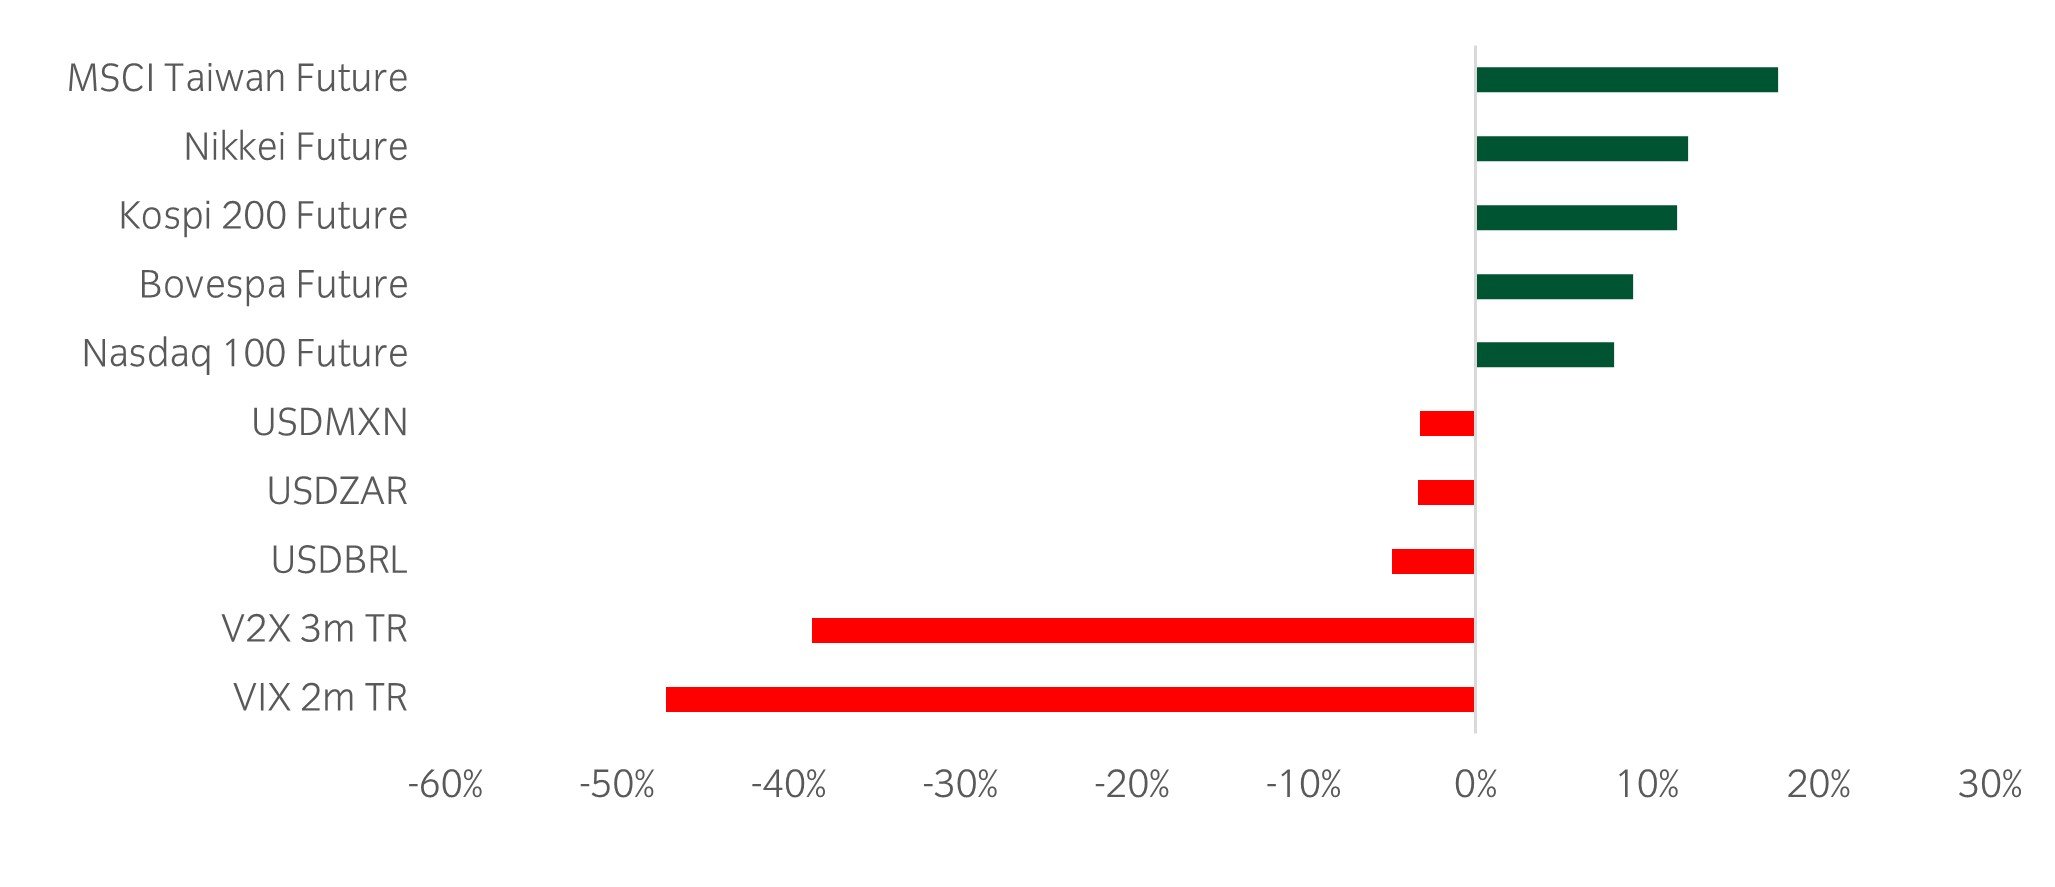
Source: Insight and Bloomberg as at 16 August 2024.
- Following an extremely volatile couple of weeks, the softer inflation print and strong retail sales shifted the narrative back to ‘goldilocks’. Markets are now basking in a bullish holiday mood with strong rallies in most major equity markets, Asian markets in particular. VIX and V2X have fallen 60% from the peak on the 5 August.
Chart of the week
Market rotates to defensive assets
Source: Insight Investment and Bloomberg as at 2 August 2024.
- Last week marked the second largest rotation from cyclical sectors to defensive sectors in the last 10 years, with a 10% underperformance of cyclical sectors. This typically reflects concerns over slowing growth, with the stabilisation this week (+1%) coinciding with more supportive data prints.
- From here, the sensitivity towards data will likely remain elevated as markets are increasingly focused on the pace of the moderation in US growth.
Market watch
Source: Bloomberg and Insight as at 8 August 2024. The price movement of each asset is shown next to its name. The data used by the bar chart divides the price movement by the annualised historical volatility of each asset.
Over the past week, several things caught our eye:
- Markets got off to a very rocky start this week. The unwinding of the Yen carry trade, combined with heightened US growth concerns dragged global equity indices down. Notably the Japanese equity market posted its worst one-day performance (-12.4%) since 1987 on Monday.
- This was also reflected in volatility markets with the VIX index hitting an intraday high of 65 (levels only seen during the GFC or Covid). There have been signs of stabilisation as the week has progressed, although looking forward it appears markets have moved into a higher volatility regime.
- A higher ISM services PMI and lower initial jobless claims number helped to ease nervousness around a growth slowdown. The services PMI was +2.6 higher month-on-month, coming in at 51.4 while the jobless claims number ticked down to 233k (below expectations of 240k).
Winners & losers: Despite a strong bounce from the huge move lower on Monday, Japanese equities are still down on the week. EM local debt was marginally higher in a week dominated by negative returns.
Asset allocation observation
US Treasury performance after extended Fed pause
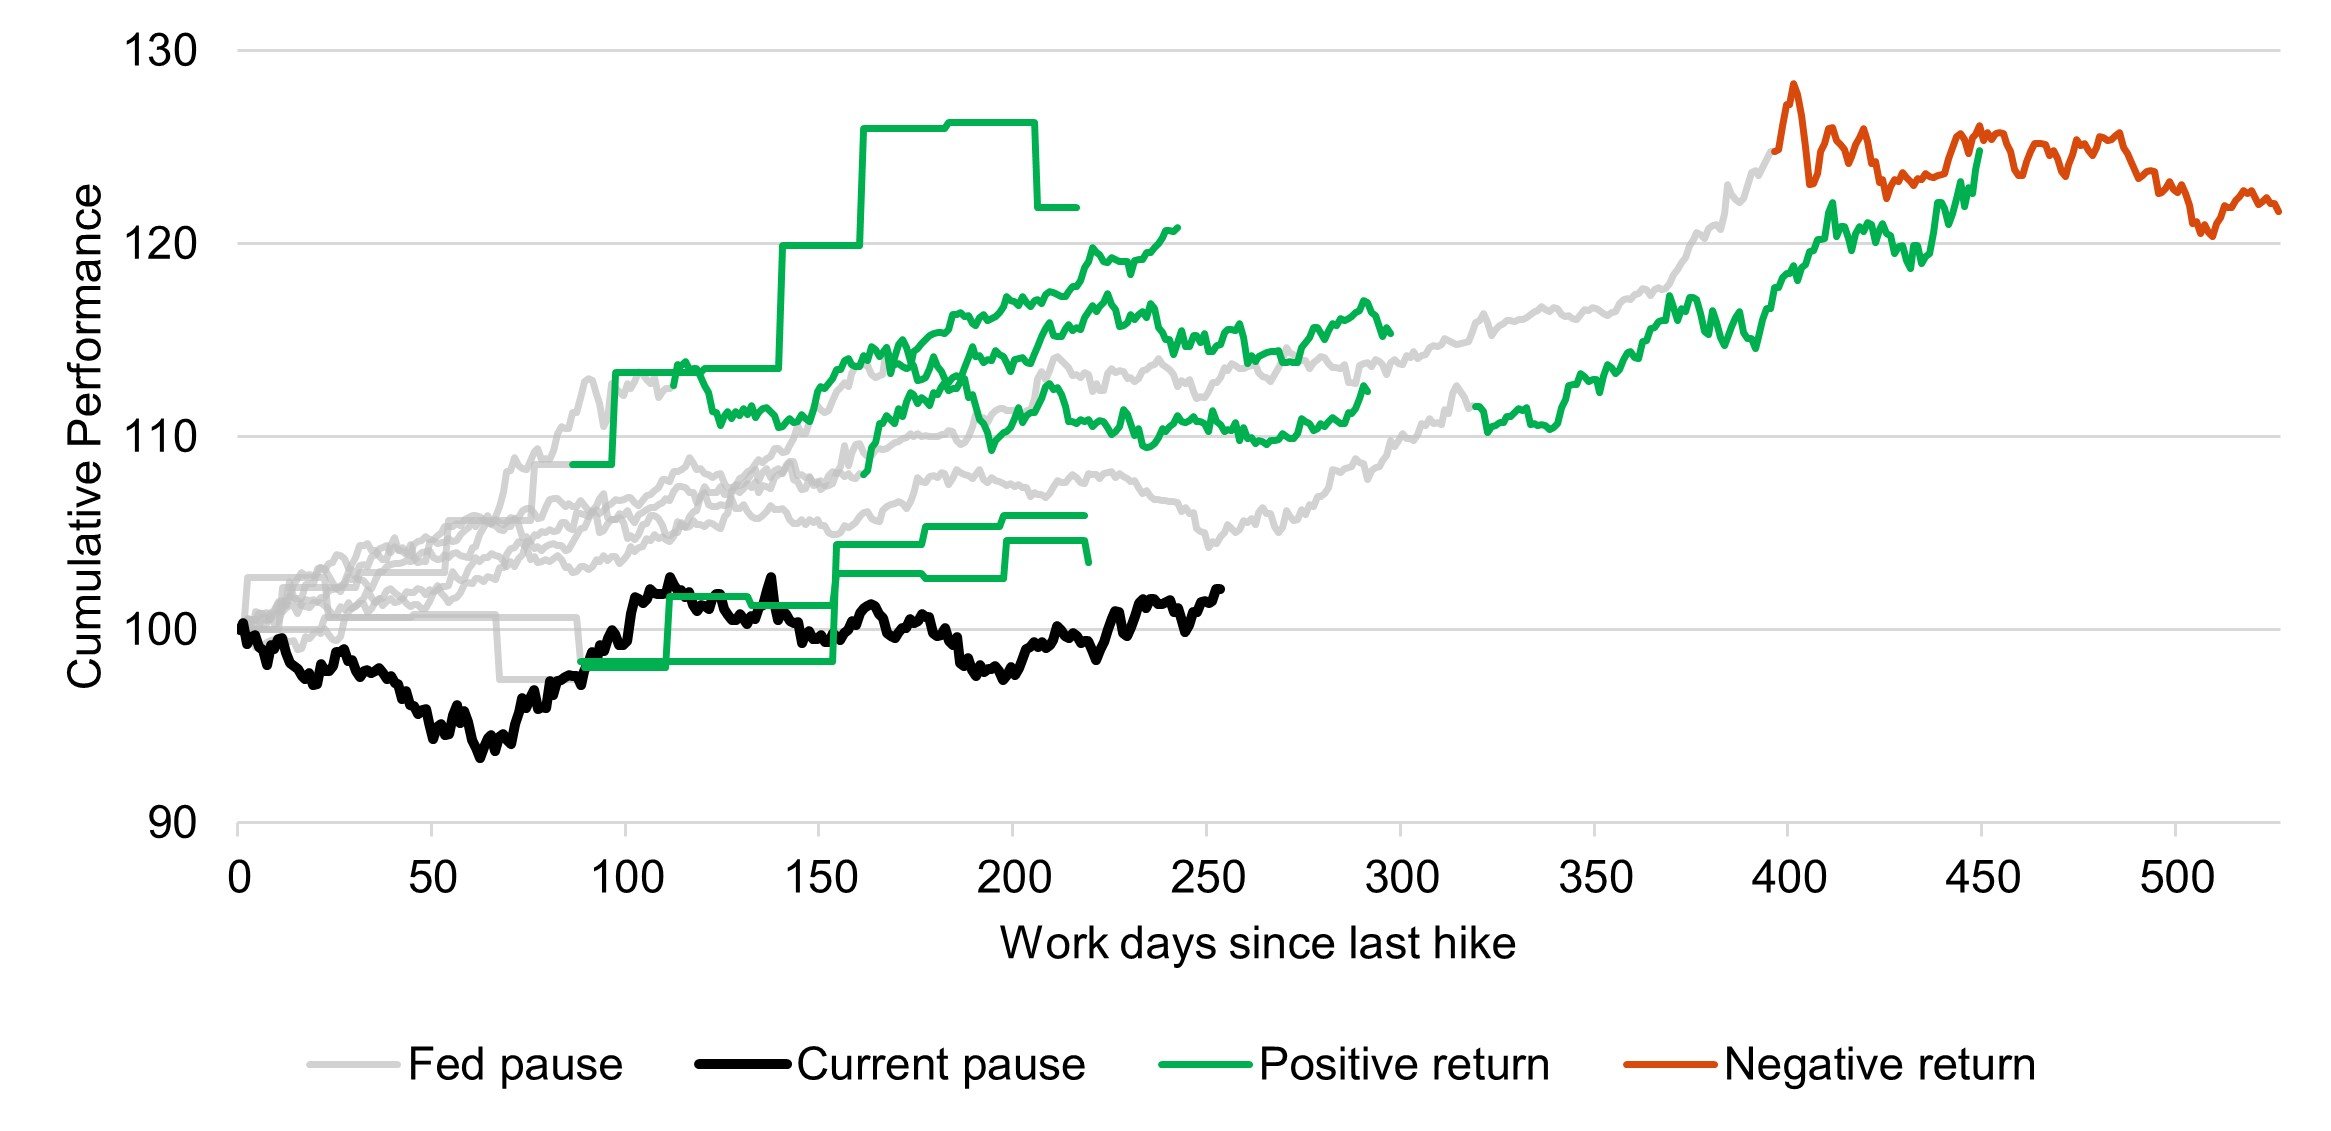
Source: Insight and Bloomberg as at 9 August 2024. Black line is current, green line indicates positive returns, red line indicates negative returns.
- Following an extend period on hold, the Federal Reserve is expected to start its easing cycle at its next meeting on 18th History tells us that this is typically very supportive for Treasury performance (see chart above).
- In our view, after a period of inflation being the primary concern dominating central bank thinking, the balance of risks between growth and inflation have become far more balanced. To that effect, we have reduced the cyclical weight of the portfolio and begun tactically adding to our duration positioning.
Chart of the week
A global easing cycle has begun (except Japan)
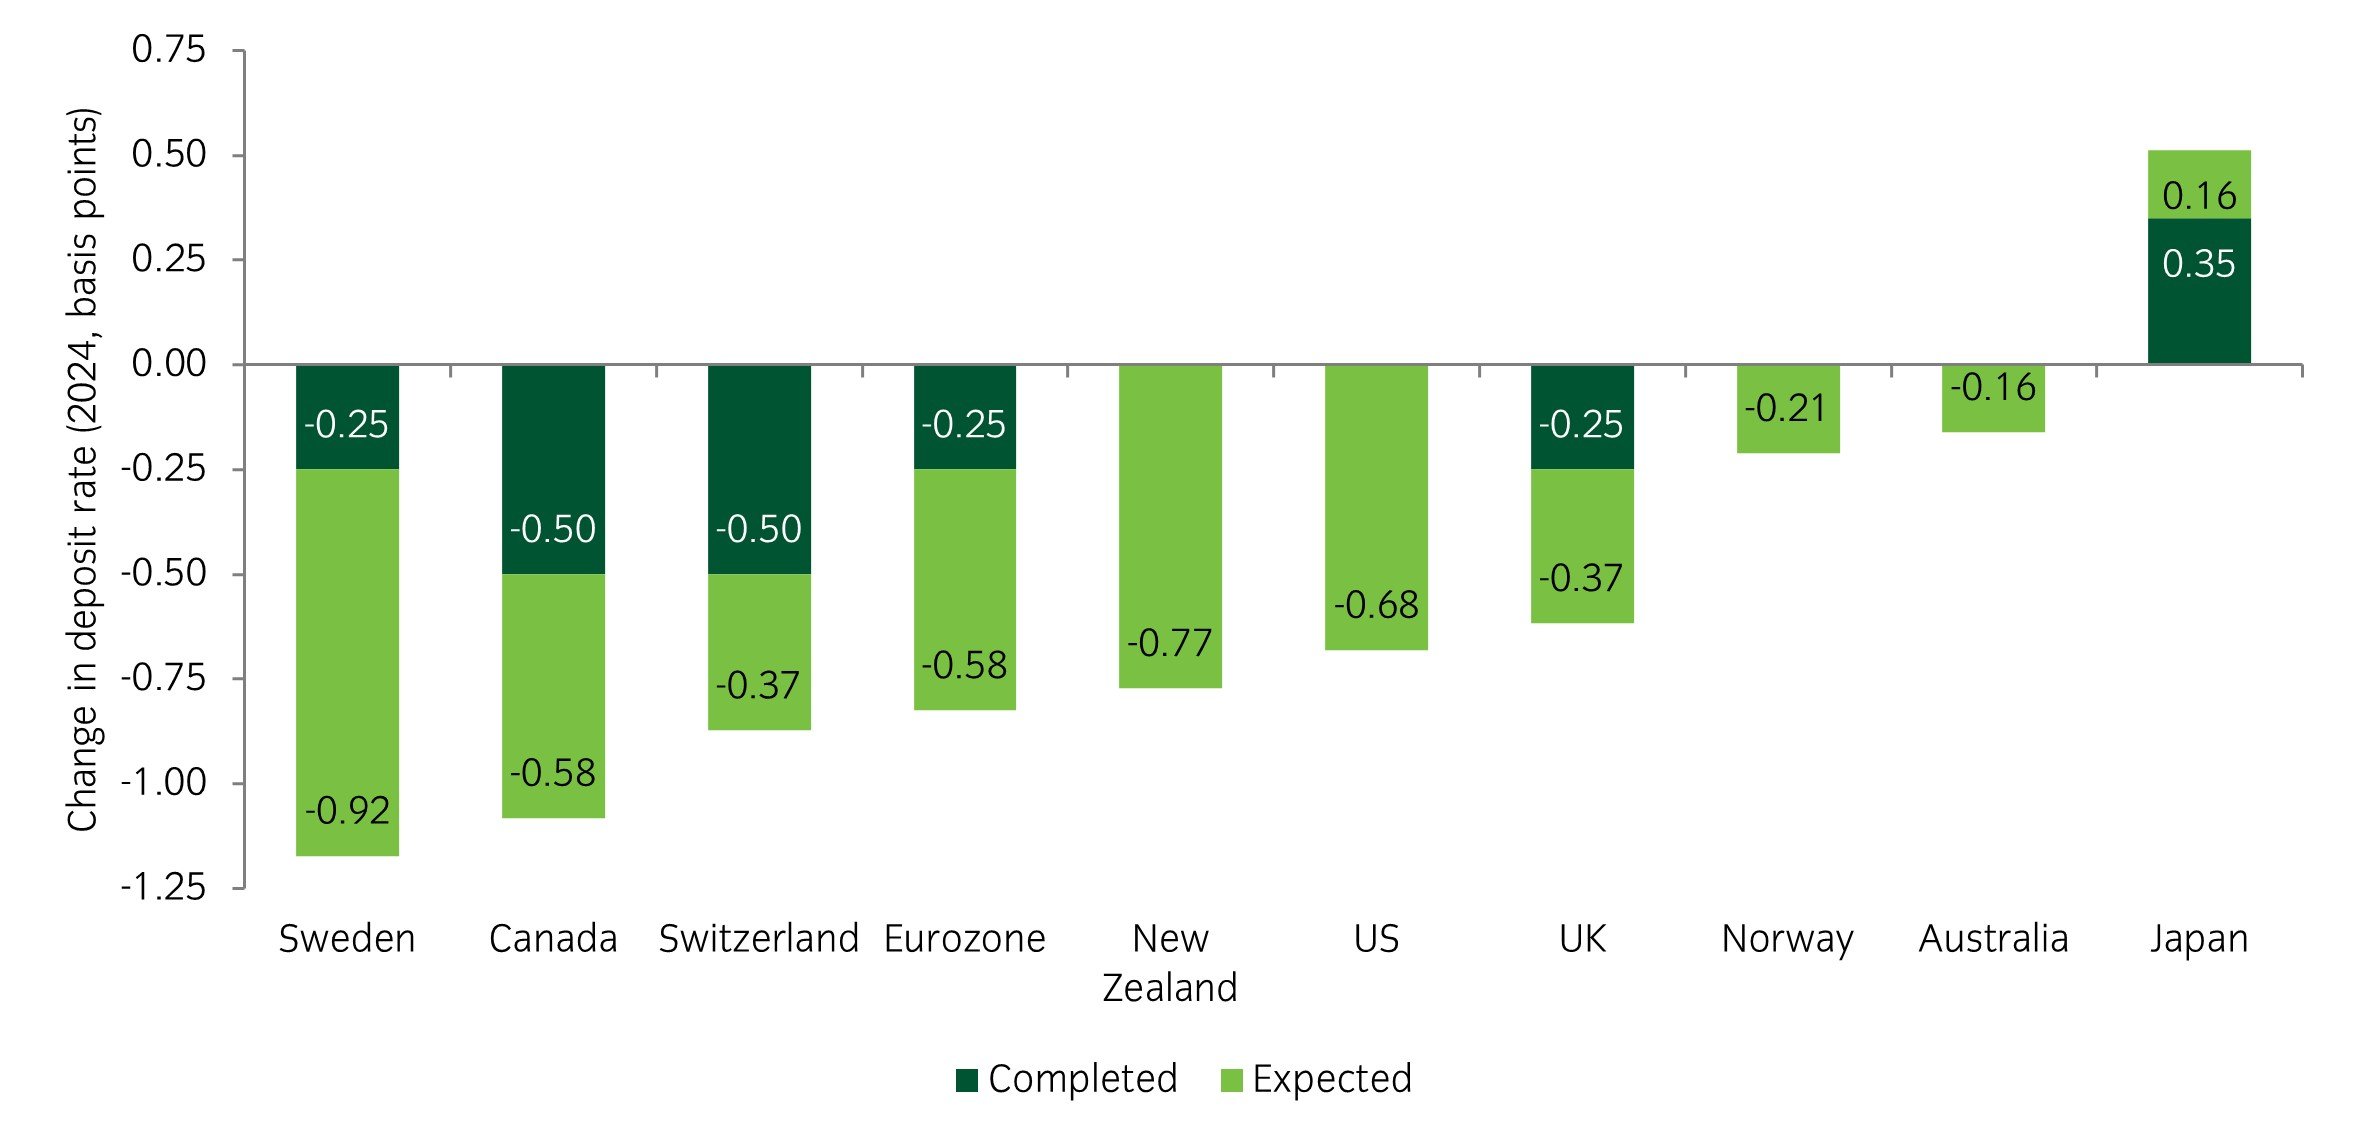
Source: Insight Investment and Bloomberg as at 2 August 2024.
- The global easing cycle has well and truly begun, with the Bank of England and European Central Bank already cutting rates and the Fed hinting that they will start in September.
- Only Japan is bucking the trend with the Bank of Japan hiking 15bp this week to levels last seen in 2008.
- The widespread cuts reflects the fact that central banks see the risks to growth and inflation have become more balanced.
Market watch
Source: Bloomberg and Insight as at 2 August 2024.The price movement of each asset is shown next to its name. The data used by the bar chart divides the price movement by the annualised historical volatility of each asset.
Over the past week, several things caught our eye:
- (close indent here) Growth concerns were taken up a notch, with the major catalyst a big downside miss in the ISM US manufacturing PMI for July. The headline of 46.8 was well below expectations (48.8) and down -1.7 from June. Importantly, the employment diffusion index hit its lowest level since the height of the pandemic in 2020.
- Adding to growth concerns, the US July jobs report released on Friday also came in weaker. The unemployment rate jumped to 4.3%.
- A busy week for corporate earnings' reports produced a mixed set of results, with positive reactions to Meta but a negative reaction to results from Microsoft, Amazon and Intel. Notably, Intel halted dividends and announced a cost-cutting program in the face of headwinds within the non-AI chip market.
Winners & losers: Given growth concerns were the key driver of sentiment over the week, government bonds posted solid gains while risk assets underperformed. Once again, the Nikkei was the weak spot, driven by continued strength in the yen.
Asset allocation observation
US labor market adds to concerns over US growth
Source: Insight and Bloomberg as at 2 August 2024.
- July labor data showed the US economy added incrementally fewer jobs than prior months and effectively pushed the unemployment rate up to 2021 levels.
- In our view, the balance of risks between reaccelerating inflation and growth deterioration have certainly become more two-way. To that effect, we have moderately reduced the cyclical weight of the portfolio and added to our duration positioning.