 Australia


Chart of the week
Central Bank expectations for 2025
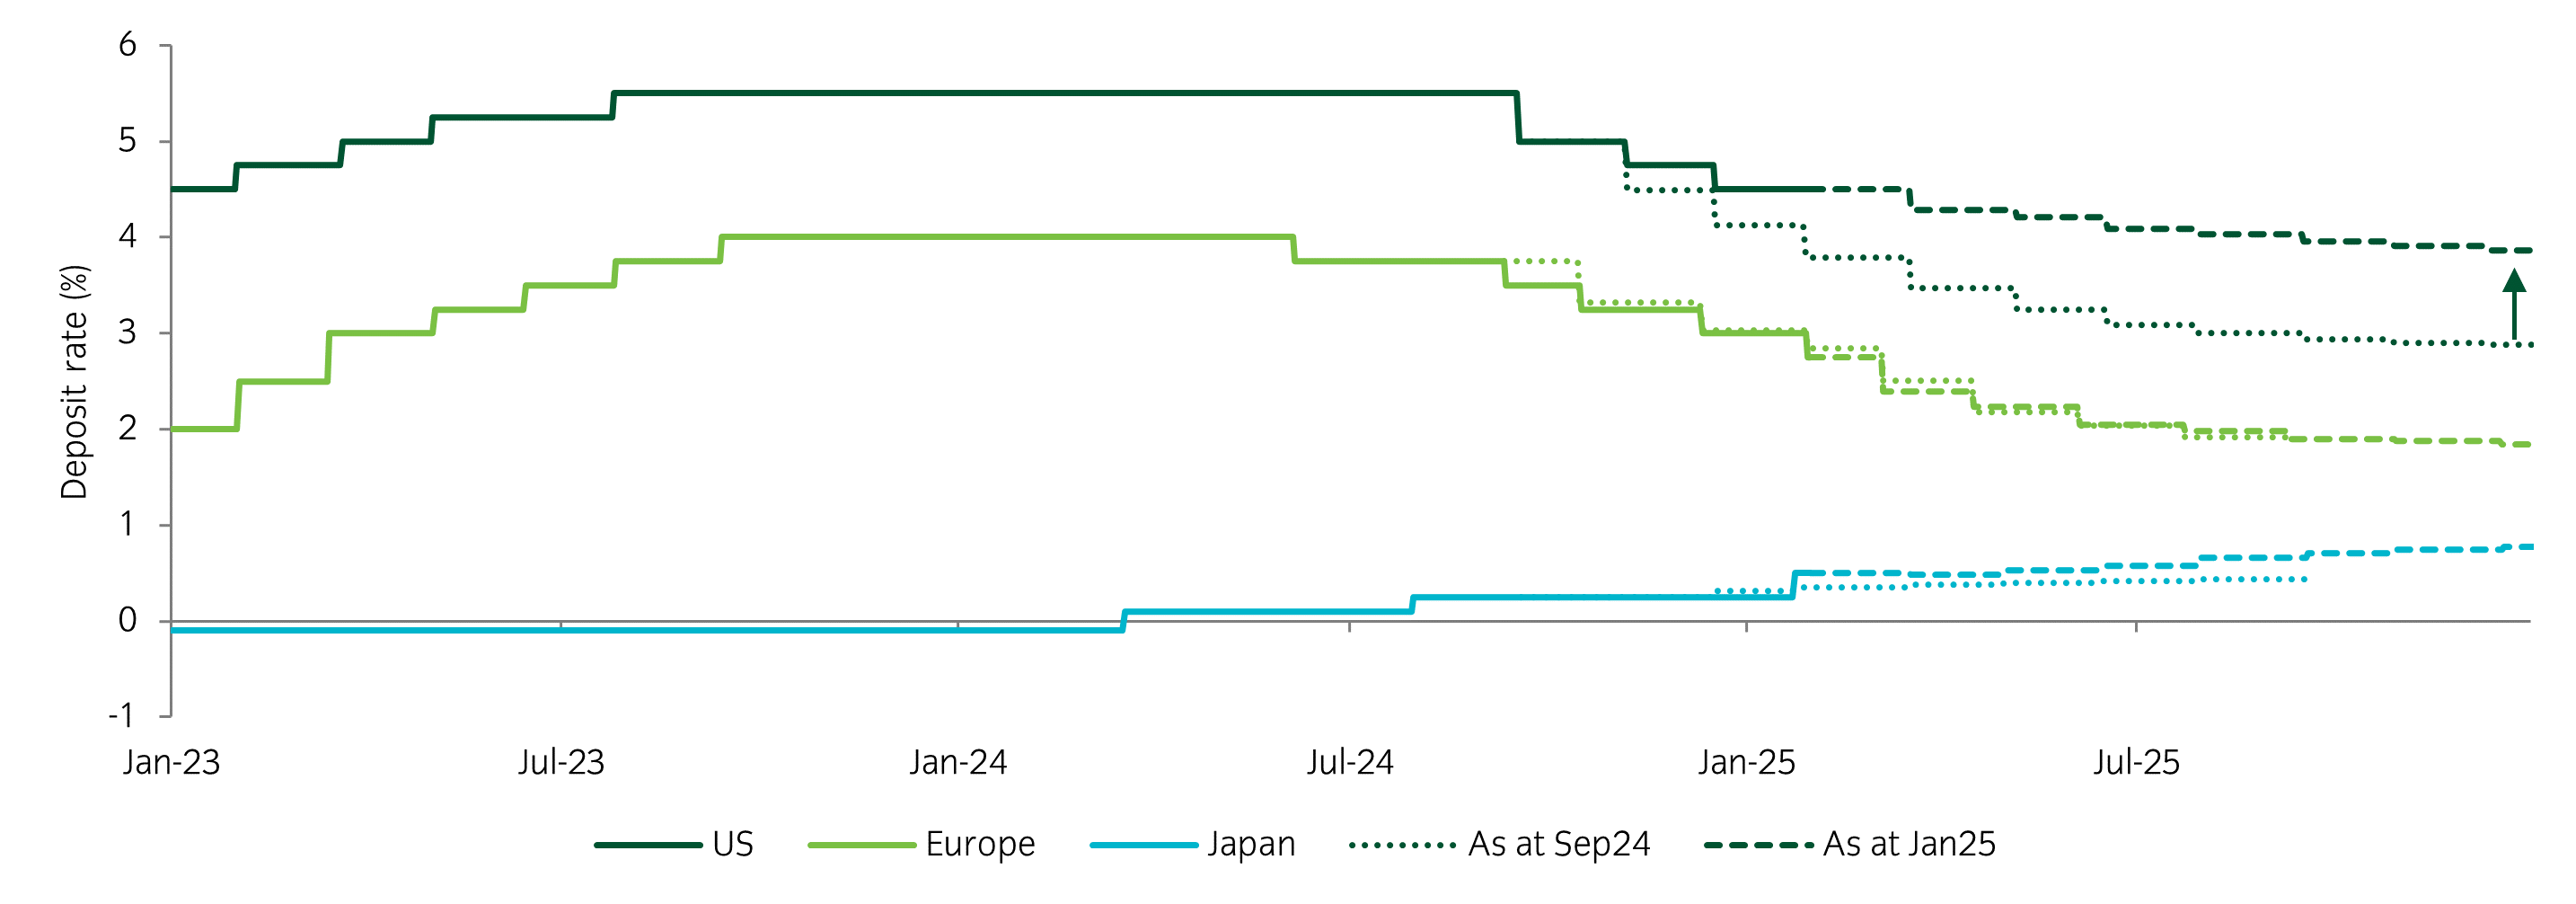
Source: Insight Investment and Bloomberg as at 31 January 2025.
- Market expectations for US and European central bank rate cuts had tempered somewhat over the past quarter. This is most notable in the US, where uncertain policy & inflation risks have pushed the markets into adopting a wait-and-see mindset.
- Conversely, the Bank of Japan (BoJ), which ended its longstanding Negative Interest Rate Policy (NIRP) in 2024, is now expected to end 2025 with a rate of 0.75%. Notably, this would mark the BoJ’s highest rate since 1995.
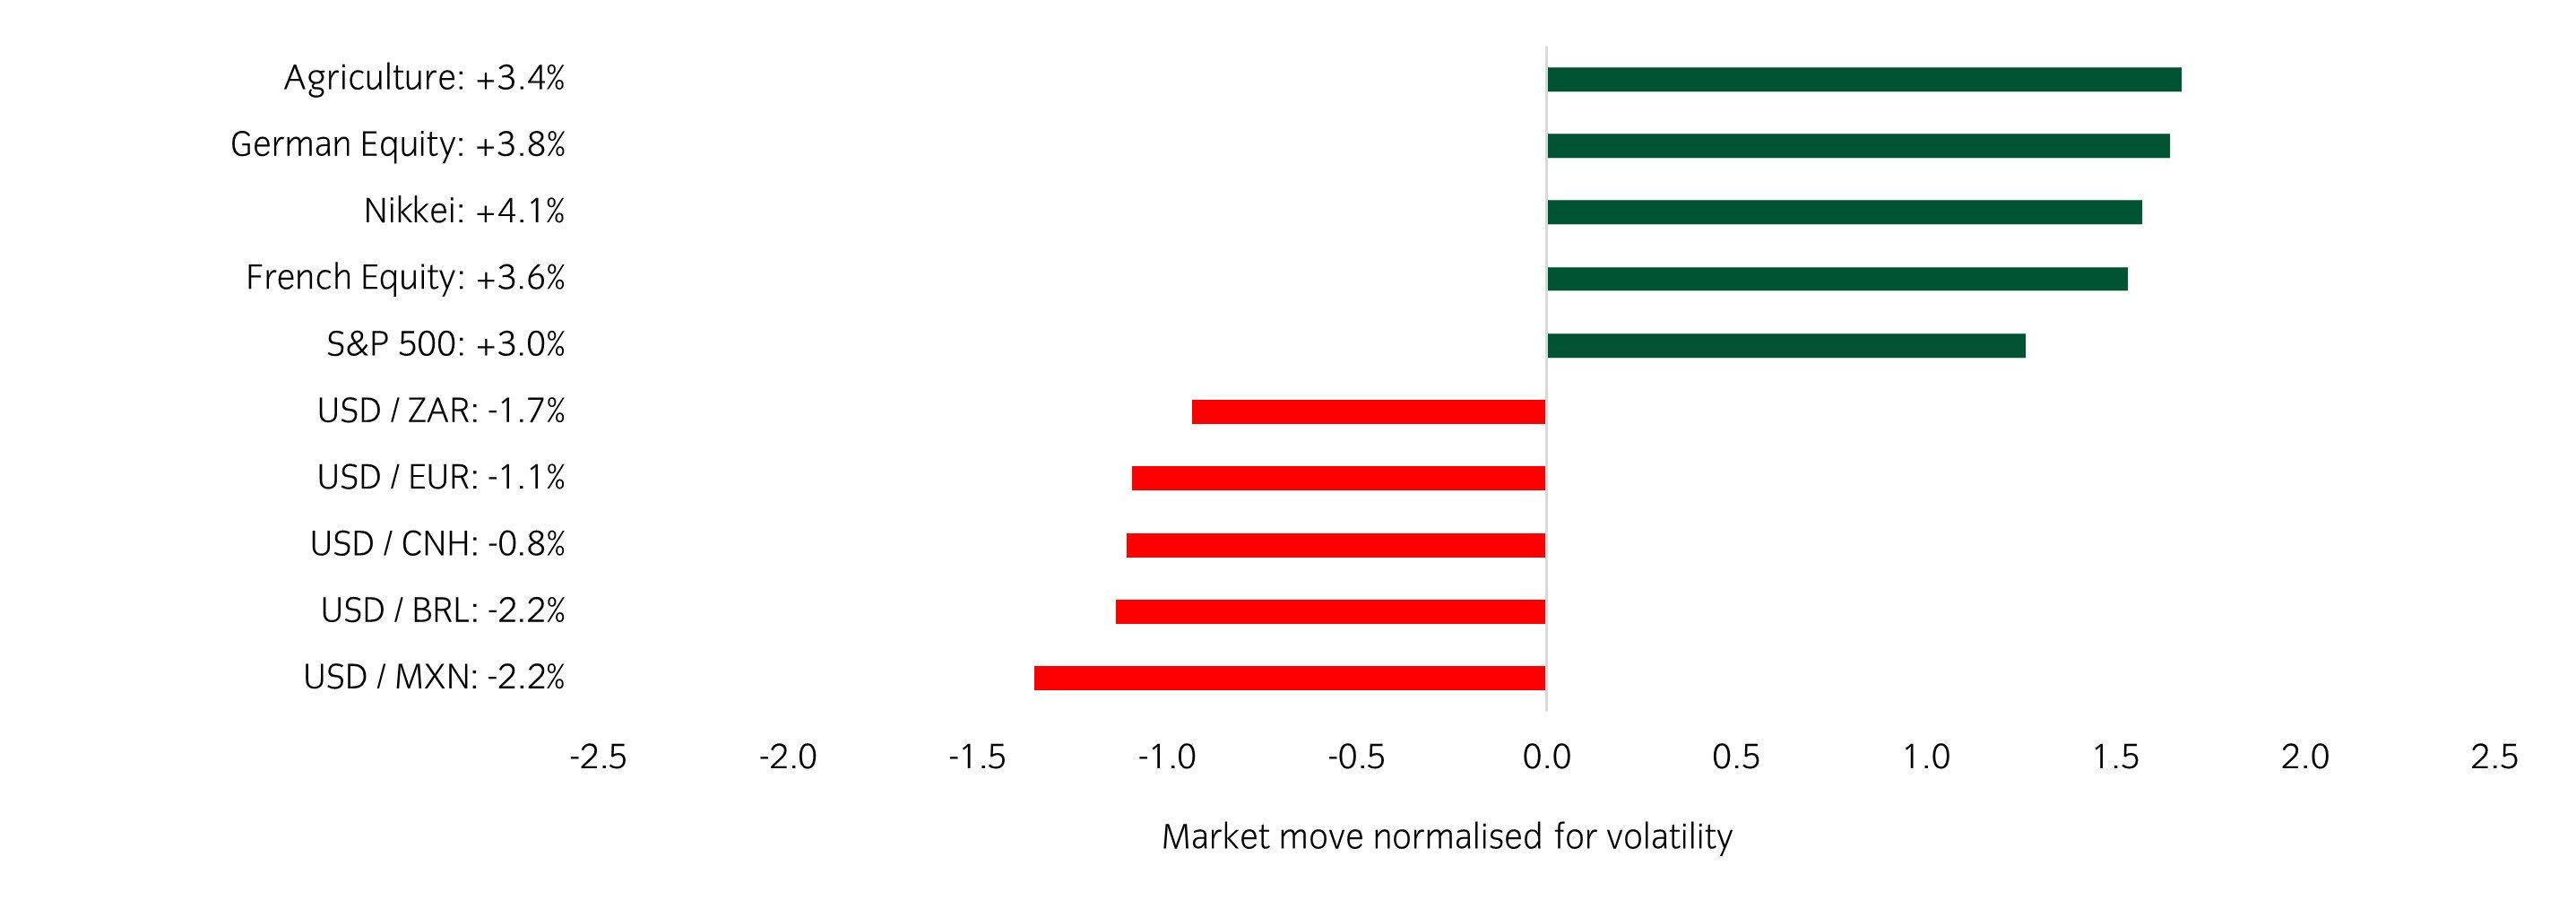
Significant market moves this week
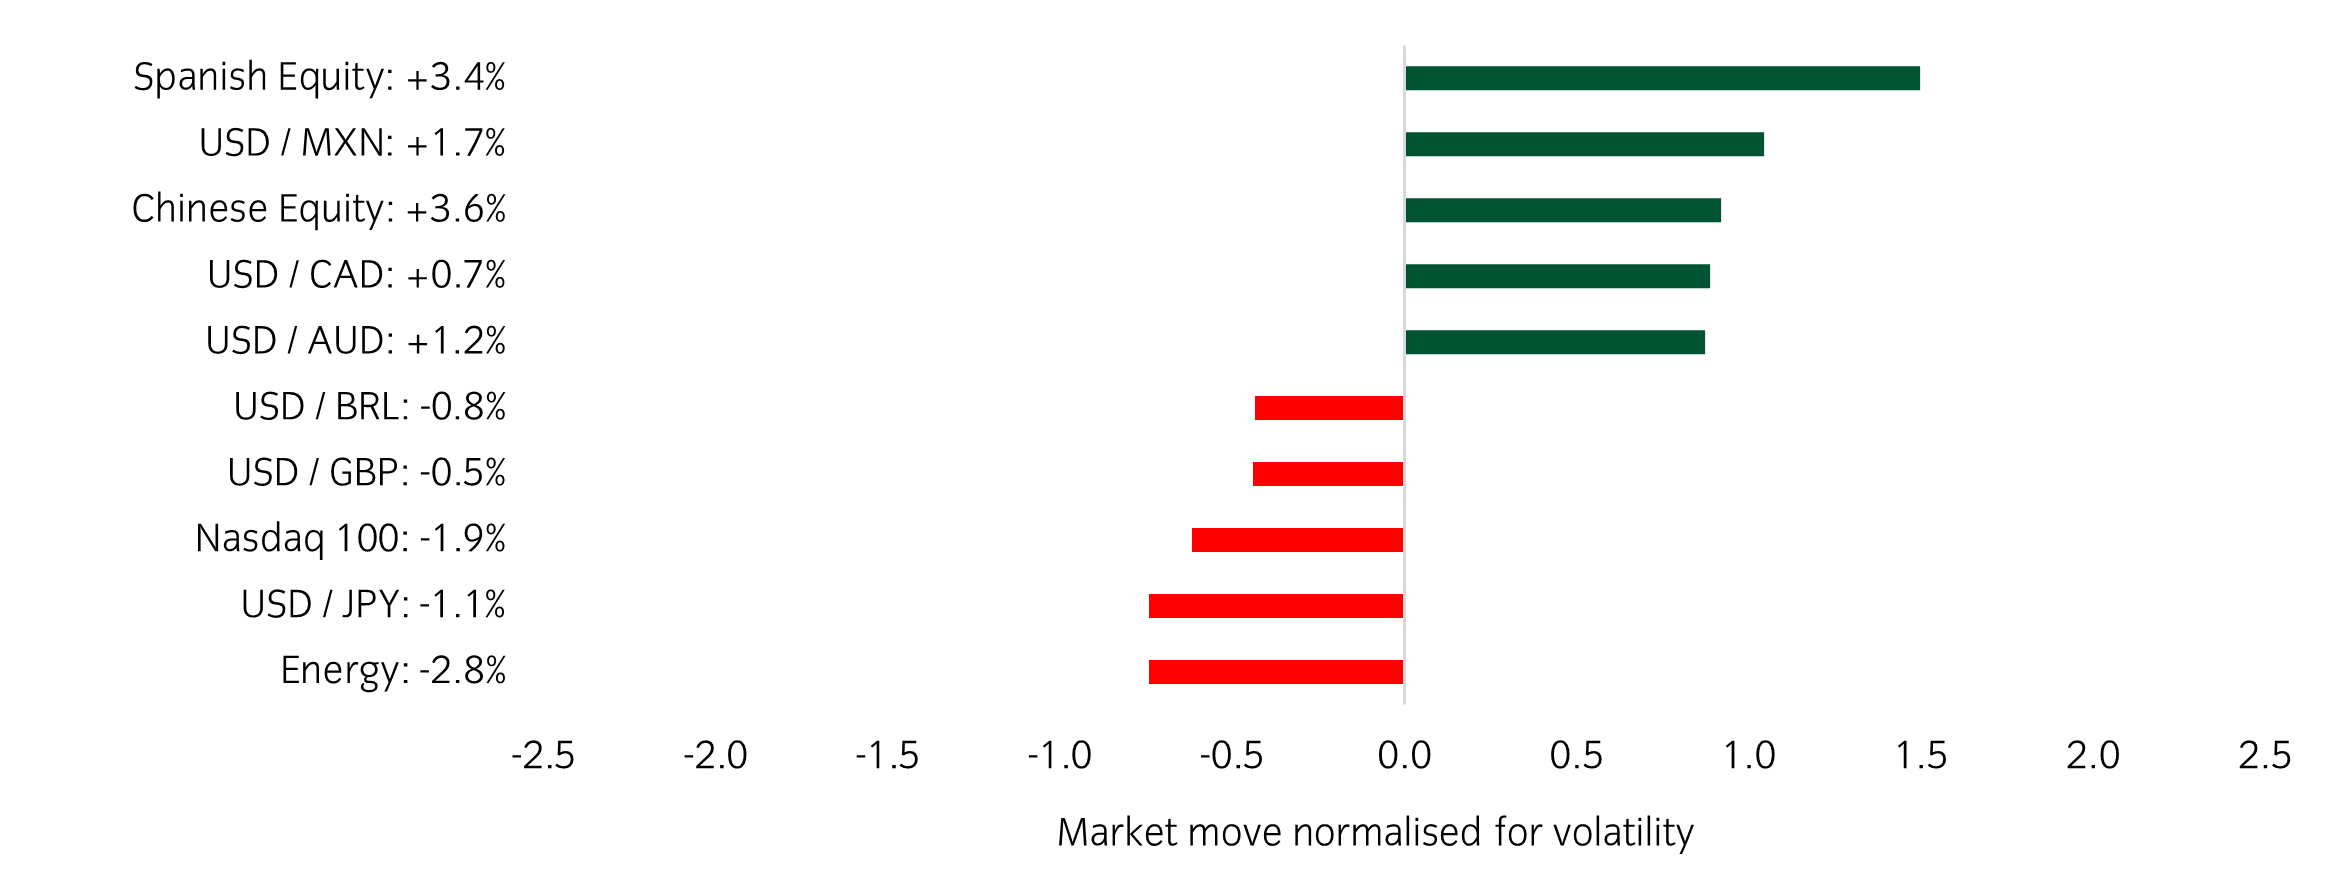
Source: Bloomberg and Insight as at 31 January 2025. The price movement of each asset is shown next to its name. The data used by the bar chart divides the price movement by the annualised historical volatility of each asset.
Winners & losers: European equities performed well on the week, while markets with a heavy link to semiconductors and AI, such as the Nasdaq, struggled.
Over the past week, several things caught our eye:
- The AI narrative was thrown a curveball this week, as the release of DeepSeek R1 has led many to question both Nvidia’s competitive moat and the current levels of CapEx from the Megacap tech stocks. Nvidia lost a record $589bn in market cap (-17%) on Monday but has since stabilised.
- The Federal Open Market Committee (FOMC) and European Central Bank (ECB) held meetings this week, with both events passing without incident. The FOMC kept rates unchanged, maintaining its stance that the economy remains in a good place, but policy is still in restrictive territory. The ECB opted for a 25bp cut, bringing the overall rate to 2.75%.
- The Euro Stoxx 50 is on track for an 8.5% return in January which would mark its second-best start to a year ever. This can likely be attributed to low positioning and the focus of US tariffs currently being directed towards other markets (namely Mexico and Canada).
Asset allocation observation
Technology is still being rewarded on earnings
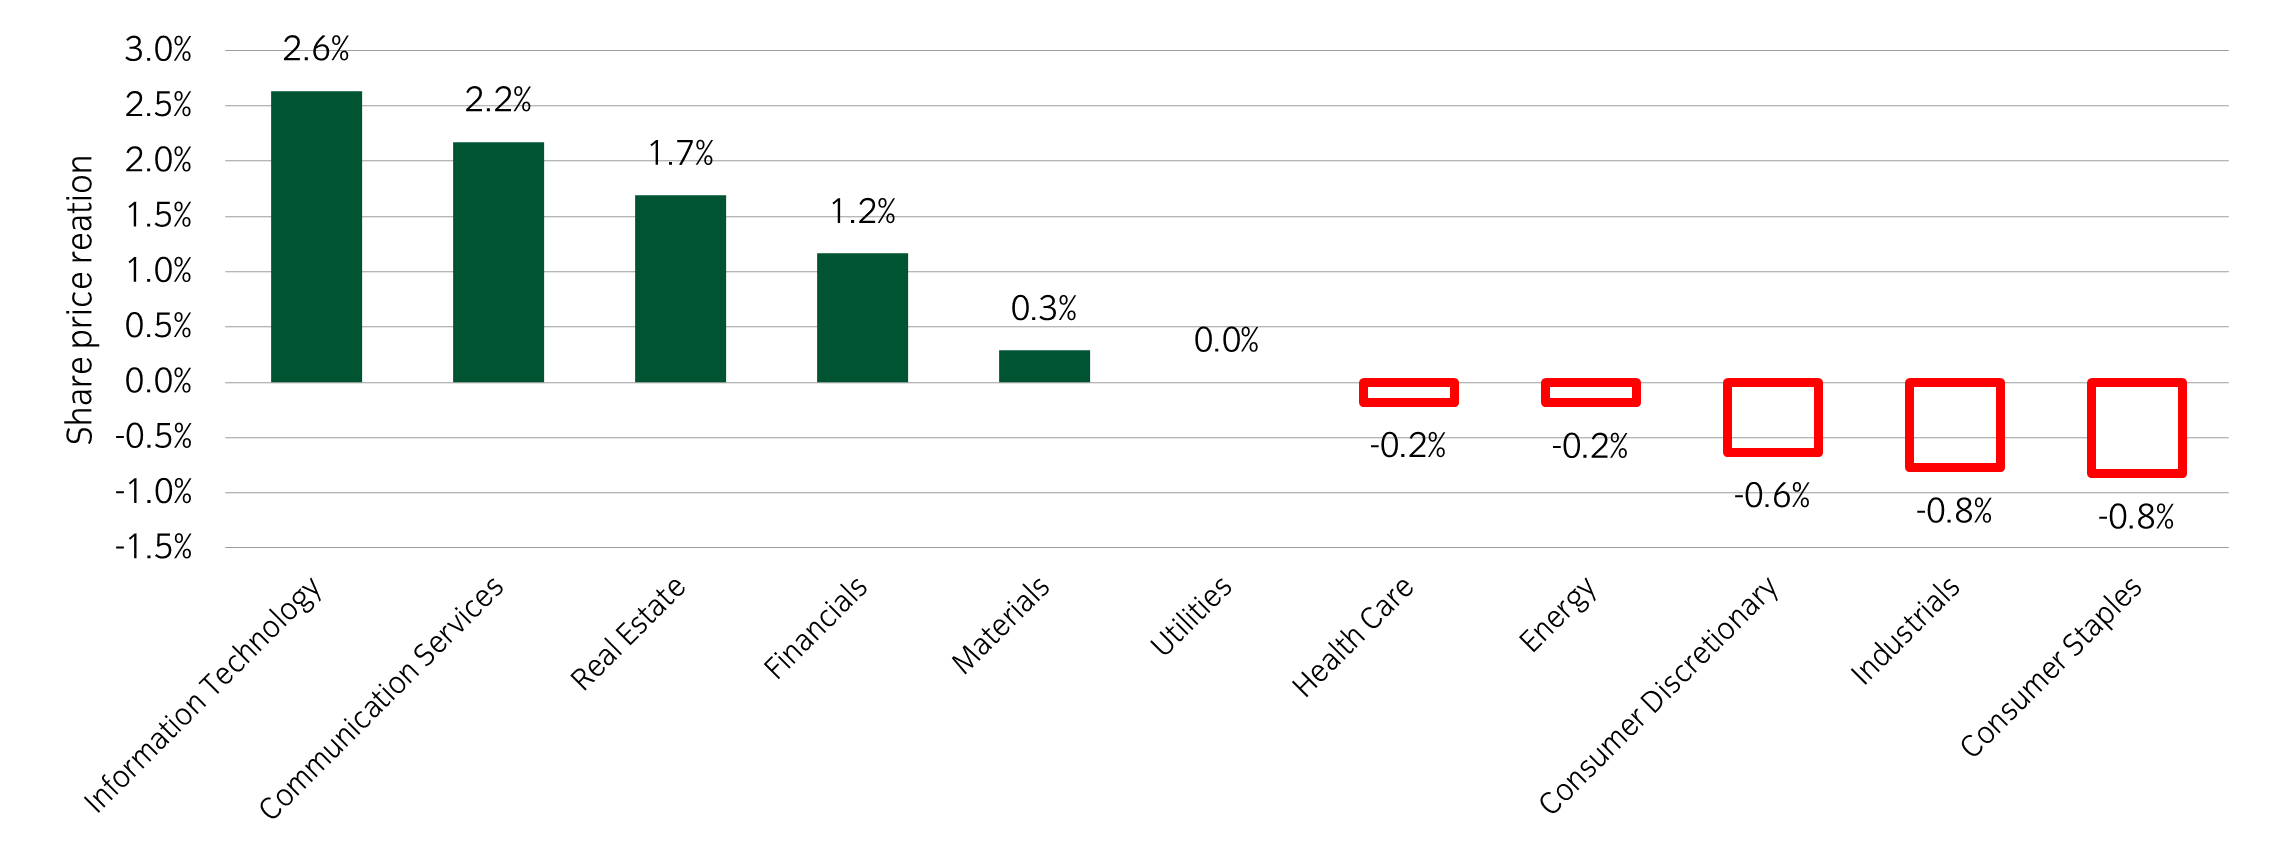
Source: Insight and Bloomberg as at 31 January 2025.
- While the Deepseek developments caused some of the largest moves for technology stocks, earnings reports this week were also an important driver. Almost 50% of S&P 500 companies have now reported, and generally earnings have been strong, with the percentage of companies beating expectations now at 80% and the EPS growth rate looking like it could push through double digits.
- Our chart this week shows that it is still technology names that are being rewarded the most in terms of share price reaction. The average share price reaction for technology sector and communication services sector (containing internet names like Meta) was above 2%. Financials have also had a strong earnings season, while staples and industrials have lagged thus far.
Chart of the week
Countries affected by US tariffs
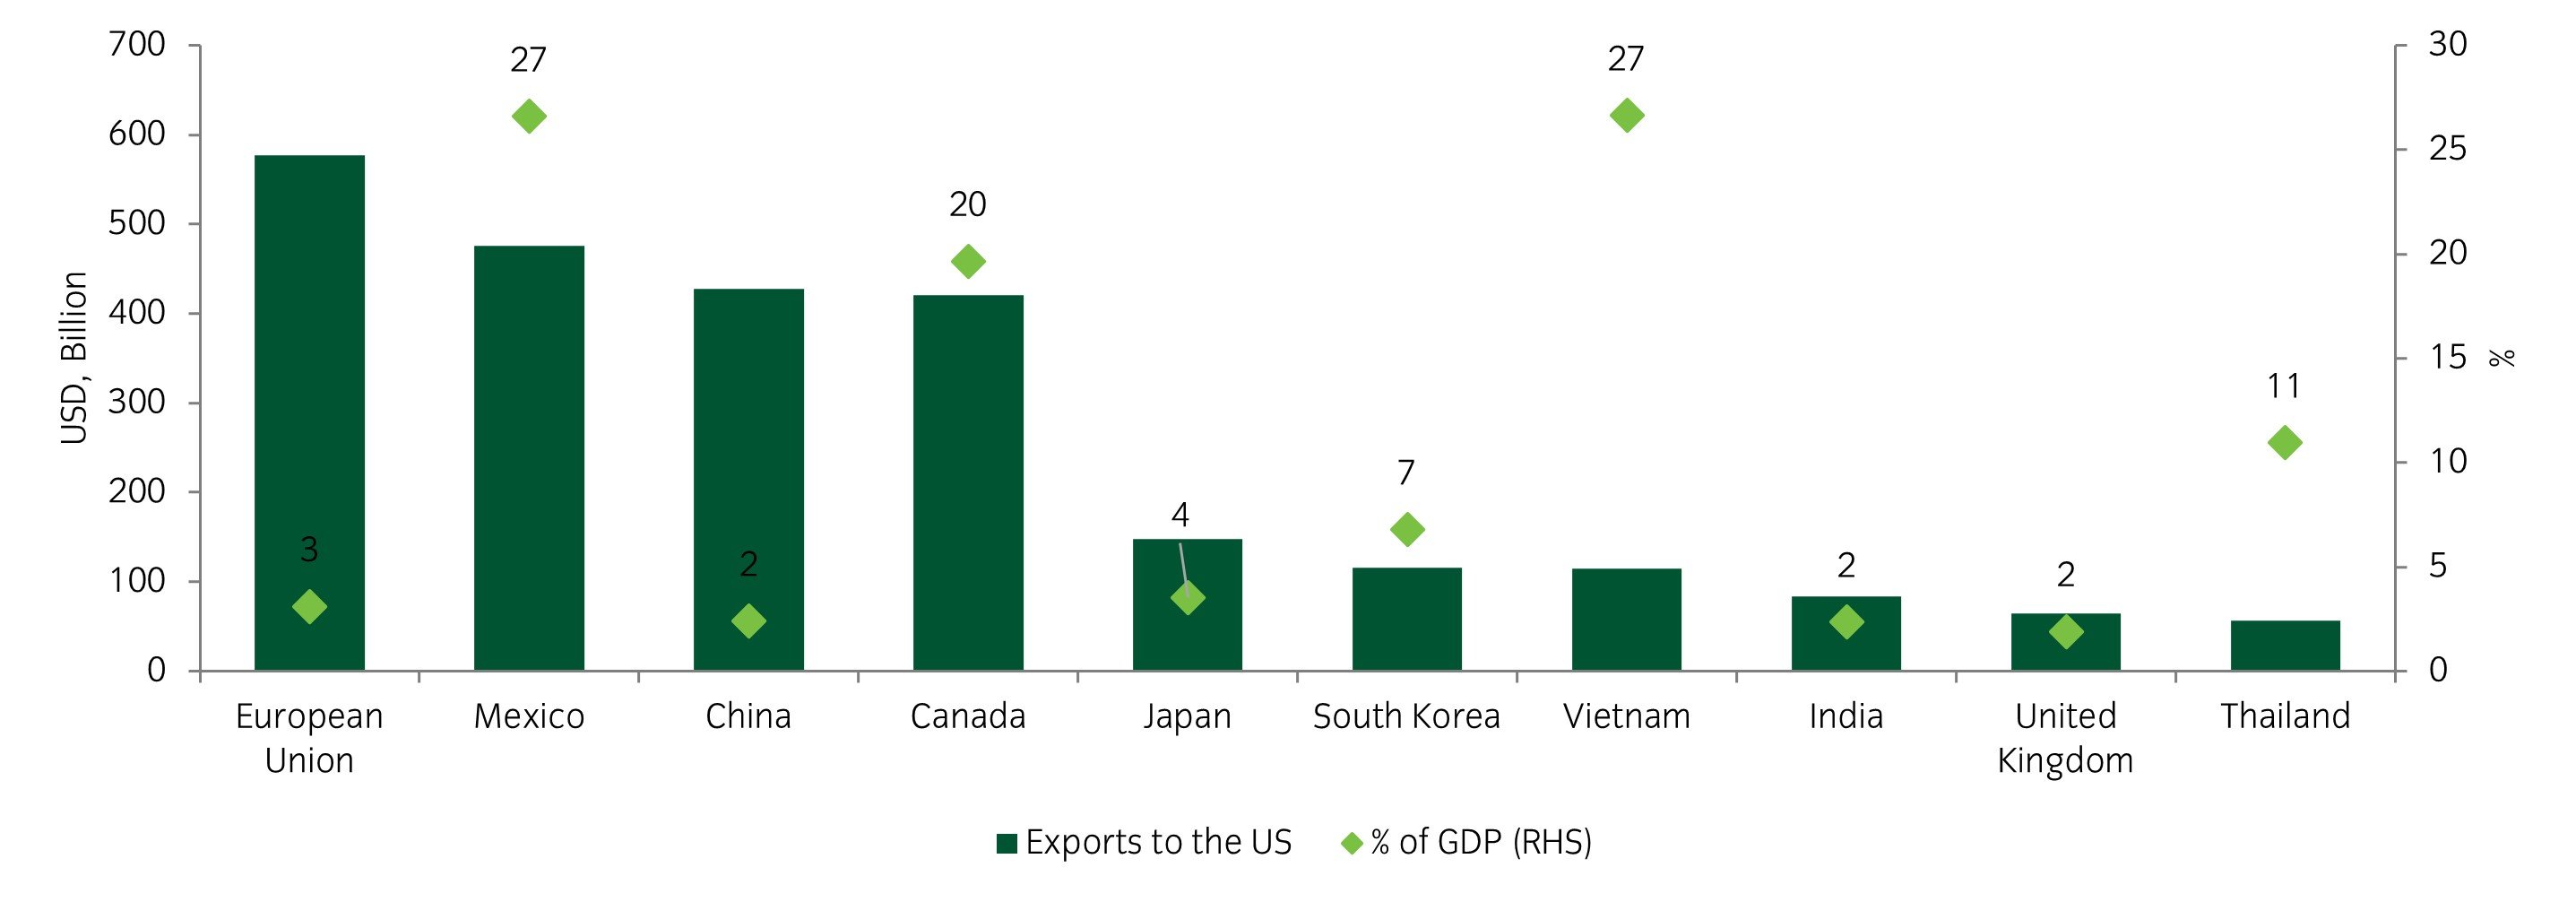
Source: Insight Investment and Bloomberg as at 24 January 2025.
- This week’s chart frames the upcoming threat of across-the-board tariffs in terms of what effect their application will have on the largest exporters to the US. While the EU is responsible for most exports in $ terms, these equate to only 3% of the EU's GDP. On the other hand, Mexico, Canada, and Vietnam all derive 20+% of GDP from exports to the US. This leaves them far more sensitive to tariff policy.
Significant market moves this week
Source: Bloomberg and Insight as at 24 January 2025. The price movement of each asset is shown next to its name. The data used by the bar chart divides the price movement by the annualised historical volatility of each asset.
Winners & losers: Equities were the outperformer this week, while the dollar moved lower for the second week.
Over the past week, several things caught our eye:
- Donald Trump was sworn into office on Monday, with the start of his second term already ushering in a wave of political noise. While most of the initial headlines should be treated with some scepticism, his comments around wanting lower rates, lower oil prices combined with a lighter touch approach to tariffs paved the way for new all-time highs in the S&P 500 and Stoxx 600 indices.
- The Bank of Japan hiked rates by 25bp to 0.5%. While the central bank made no clear commitment to future hikes, it acknowledged a rising likelihood of its economic outlook being realised. Current market pricing expects another 25bp hike in 2025.
- Flash PMIs for January showed a promising start to 2025 for hard hit German and French manufacturing sectors. The German flash PMI picked up from 42.5 to 44.1 while France rose from 41.9 to 45.3. While the improvement is encouraging, this is just the first step in the right direction for two sectors that have been in contractionary territory for over two years.
Asset allocation observation
European equities strong start to the year driven by improved breadth
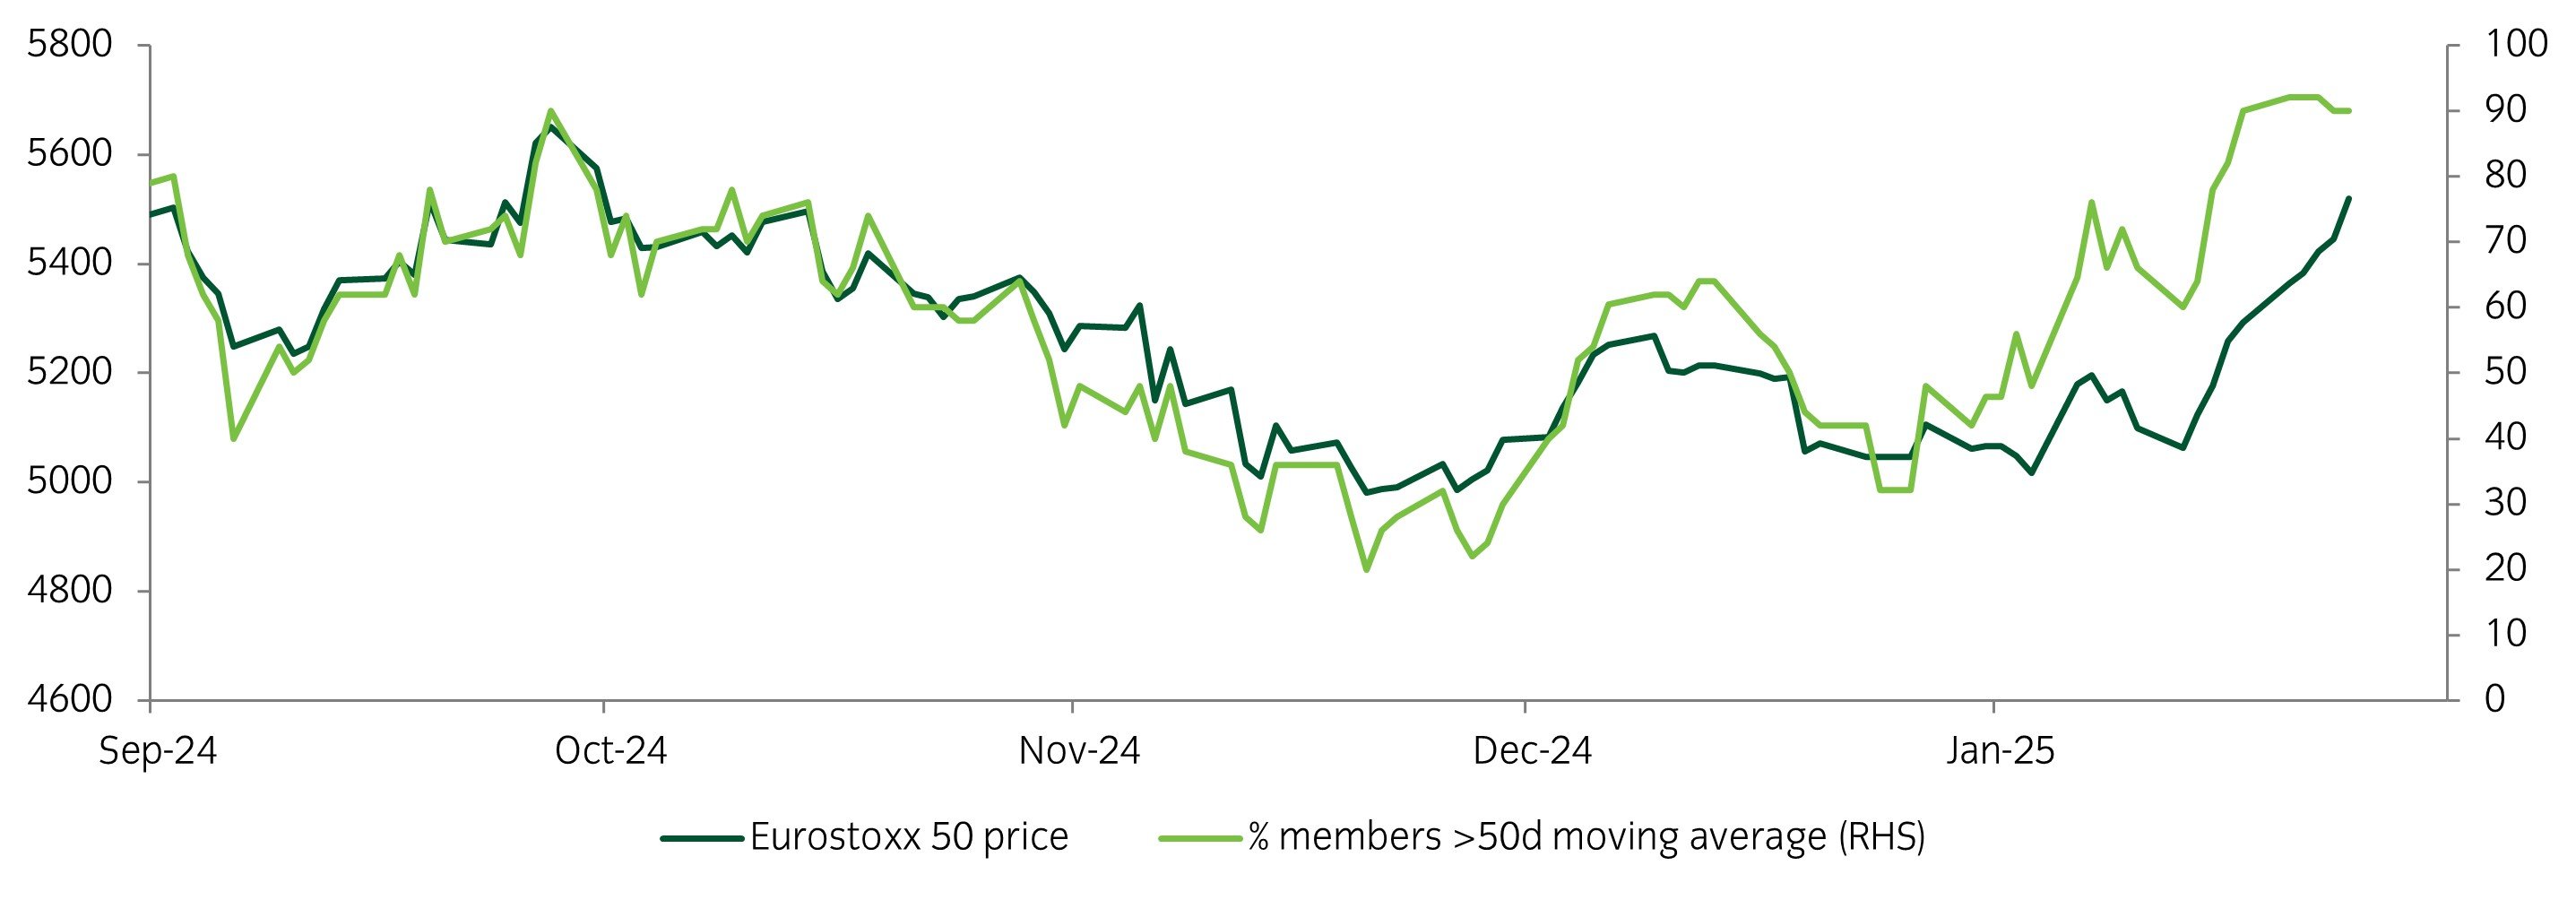
Source: Insight and Bloomberg as at 23 January 2025.
- The Eurostoxx 50 index is up 7.5% in 2025, one of its strongest starts to a year this century. Behind this move has been increased breadth, with 90% of constituents above their 50-day moving average. While the short term technicals seem stretched, Europe remains a relatively under owned market with negative sentiment having built up over the previous year. Indeed, a lack of clear tariff policy so far from the US has resulted in a squeeze higher.
- In our portfolios we have tactically added European upside exposure, making use of existing defensive option buffers.
Chart of the week
The worst ever start for bond yields in a Fed cutting cycle
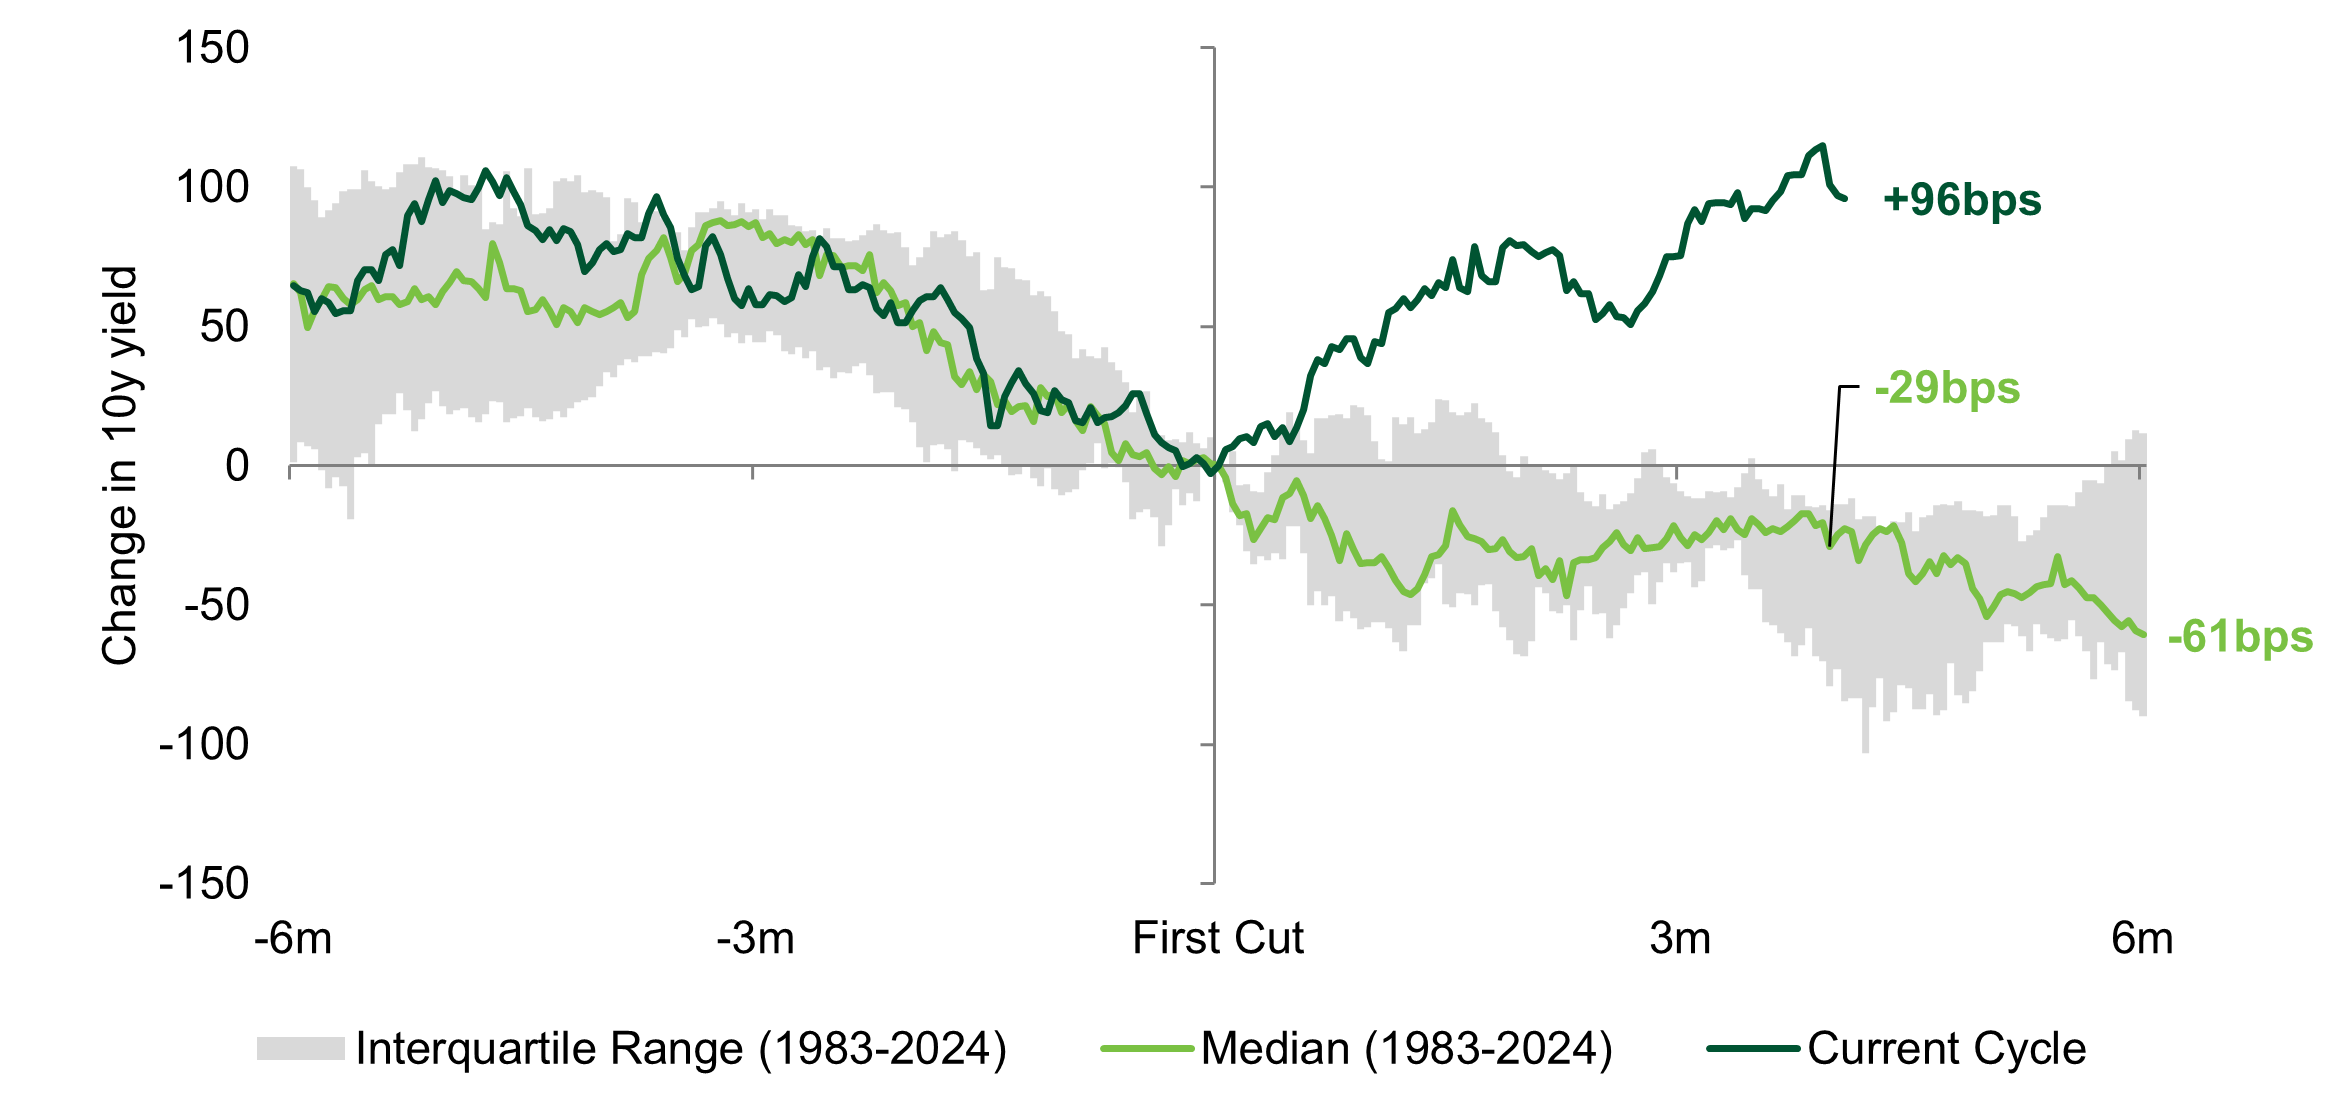
Source: Insight Investment and Bloomberg as at 17 January 2025.
- The consistent march higher in government bond yields since the Federal Reserve’s first cut back in September is very unusual compared to previous cutting cycles. Indeed, the 96bp rise in 10-year yields at this stage compares to a median fall of 29bps and maximum historical rise of +42bps. The main drivers behind this rise are sticky inflation, a robust labour market and concerns of the potential impact of tariffs.
- Within our portfolios we have maintained an underweight allocation to duration with the mindset that a shift in momentum could provide a more attractive entry point.
Significant market moves this week
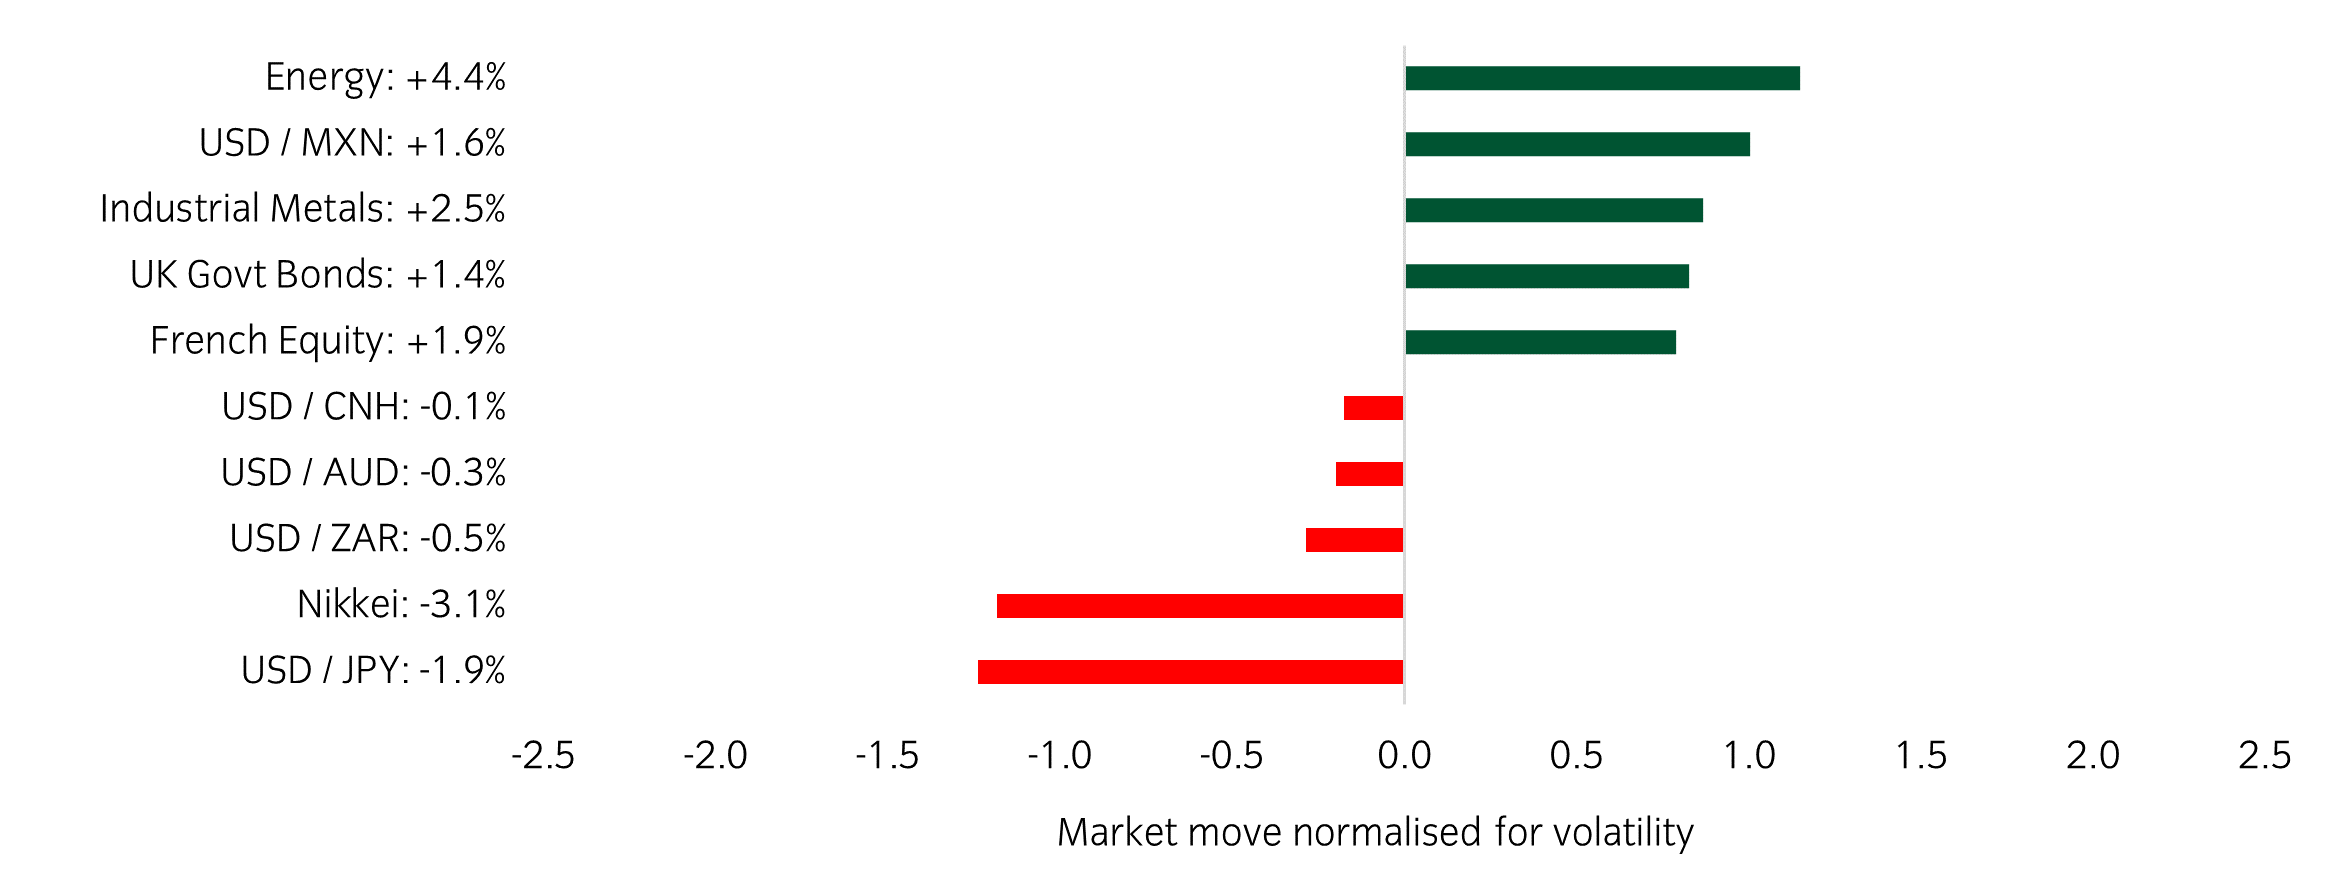 Source: Bloomberg and Insight as at 17 January 2025. The price movement of each asset is shown next to its name. The data used by the bar chart divides the price movement by the annualised historical volatility of each asset.
Winners & losers: Commodities were the outperformer this week while UK gilts made a recovery following a poor run. Other notable moves came from Japan, with the Nikkei falling and Yen strengthening.
- Inflation data largely came as a relief to markets this week, as the sharp rise in bond yields prior to the release had started to spill over into risk assets. While US CPI rose from 2.7% to 2.9% year-on-year, the surprise miss in month-on-month core CPI (0.2% vs 0.3% expected) spurred a 15bp rally in 10-year Treasuries.
- The Bank of Japan hinted at a rate hike at its upcoming meeting on 24 January. Markets are currently implying a 90% probability of a 25bp hike following Governor Ueda’s comments that “we would like to discuss and decide whether to raise interest rates". If realised, a rate rise would bring the overall rate to 0.5%, its joint highest level since the early 1990’s.
- This week marked the last trading days under the Biden administration, a period in which the S&P 500 has returned 64%, just above the average of 54% but below his successor’s first term of 83%. Already there is plenty of noise from the Trump camp around potential tariff policies, with the first 100 days expected to be very active in terms of implementing his agenda.
Asset allocation observation
US Banks get earnings season off to strong start
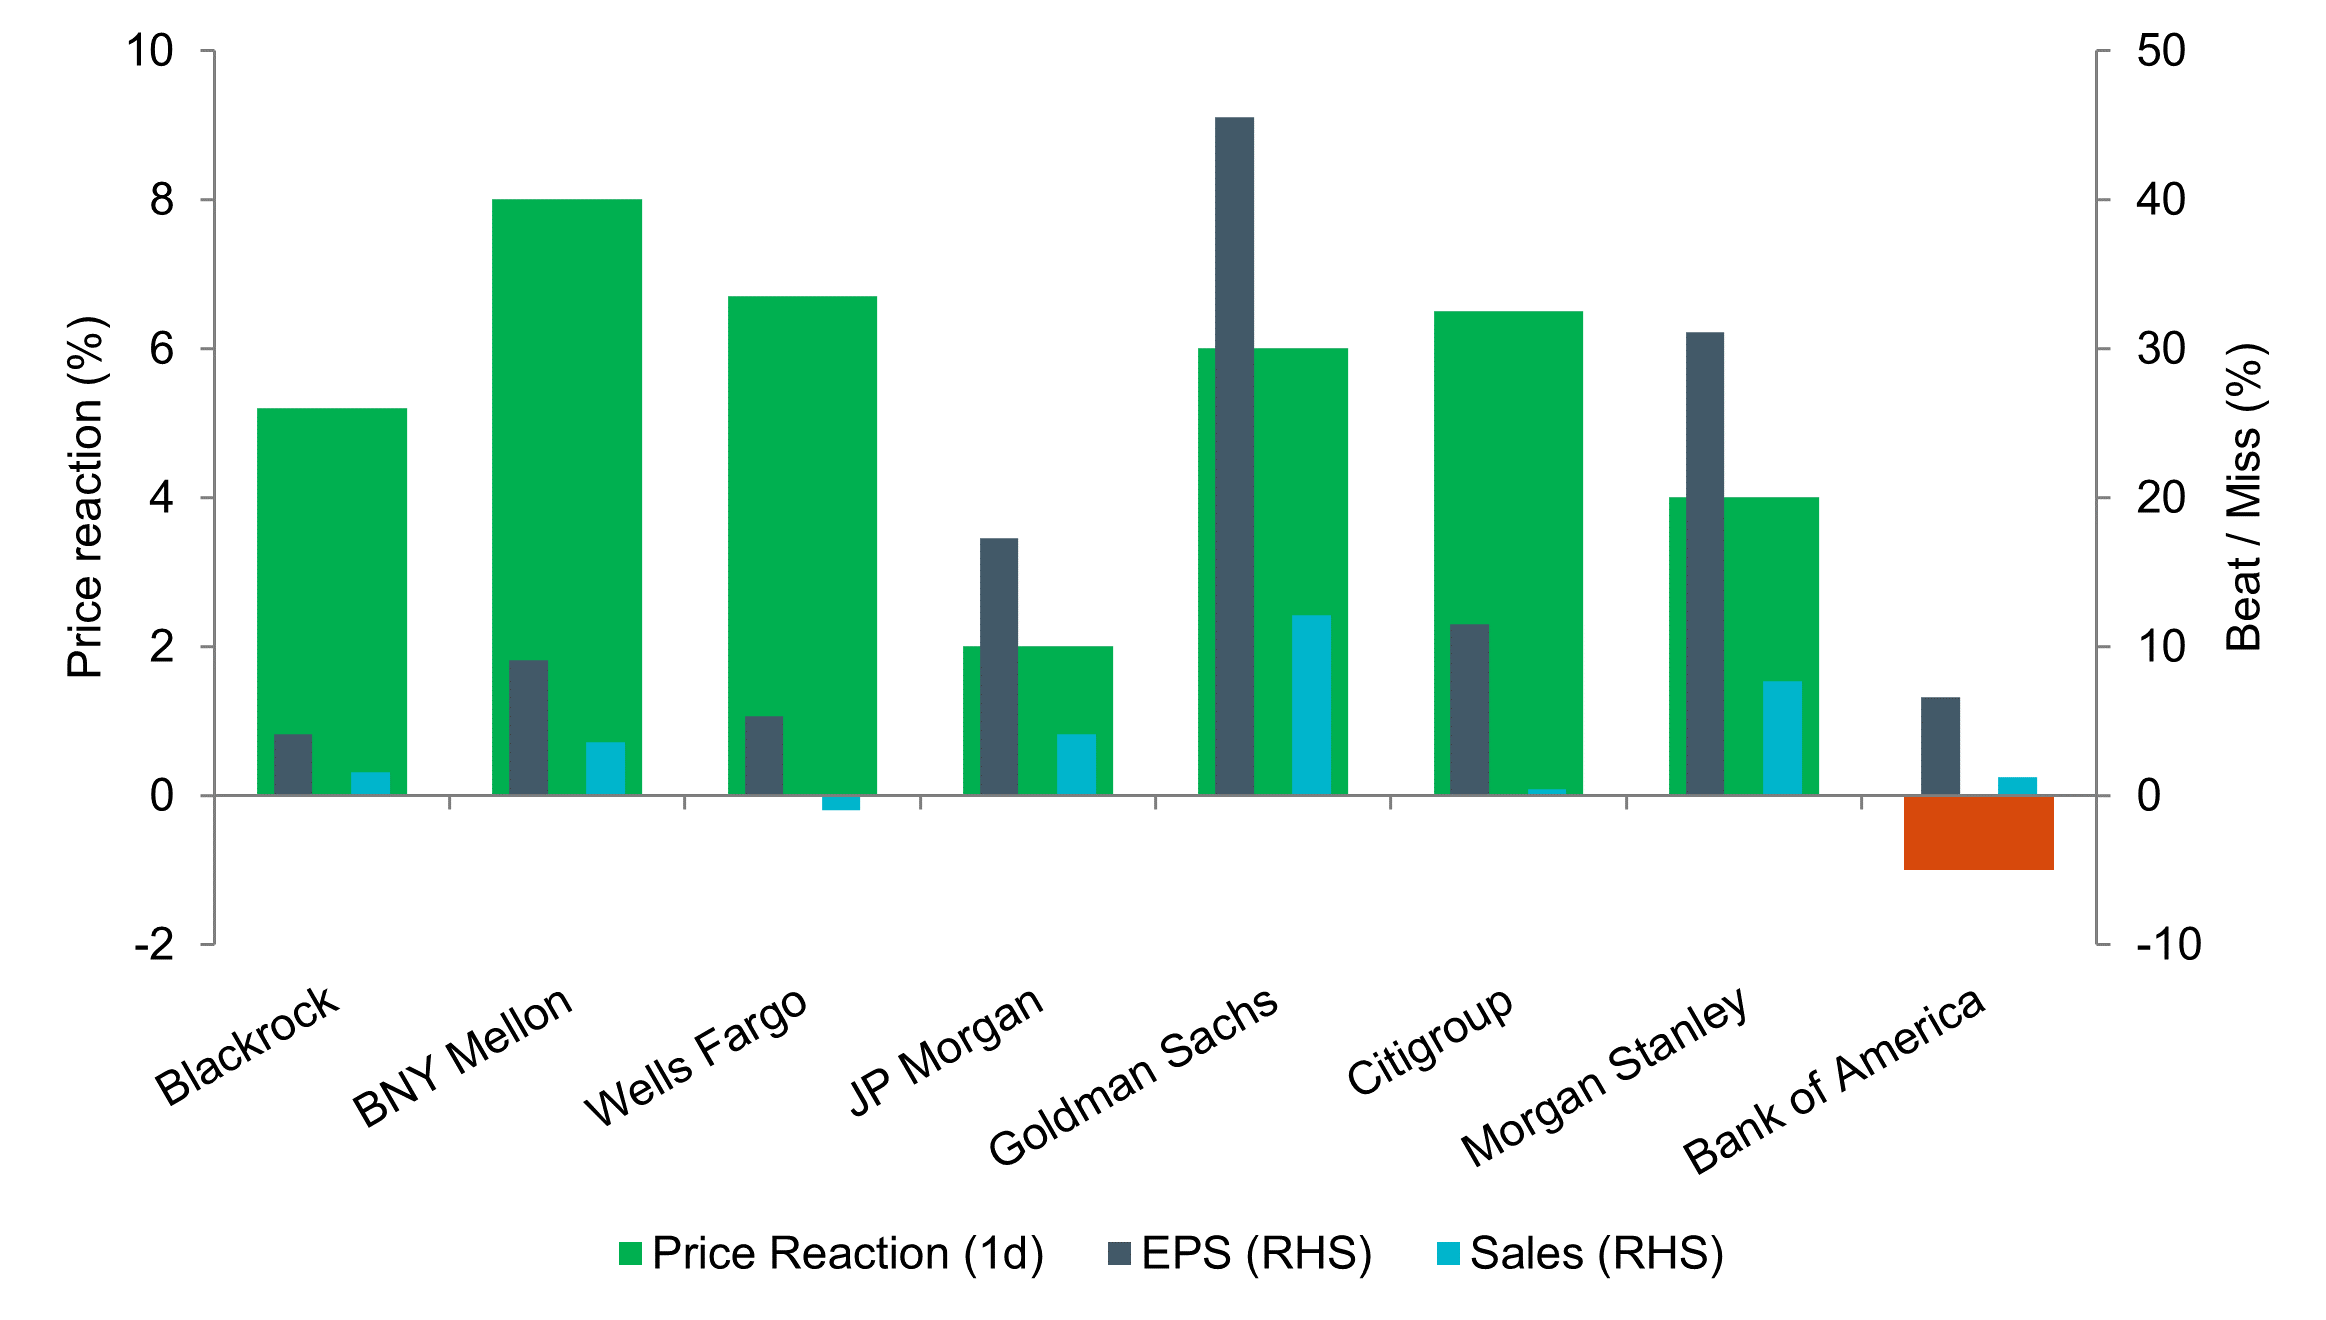
Source: Insight and Bloomberg as at 17 January 2025.
- Earnings season kicked off in earnest this week, with the large US banks reporting. It was a very strong start with the banks largely beating expectations to cap off their second most profitable year. Capital markets business growth was notably strong, while provisions for credit losses remain low. Our chart shows how strong the price reaction was across the suite of reporting companies. There were also some notable global earnings beats from semi manufacturer TSMC and European luxury name Richemont.
Most read
Multi-asset

March 2025
Multi asset chart of the week
Global macro, Currency

June 2023
Global Macro Research: 30 years in currency markets
Global macro

January 2022
Global Macro Research: Asset allocation, growth and inflation cycles
Global macro, Fixed income

October 2023