 Australia


Chart of the week
Manufacturing rebound stabilising, but not yet stumbling
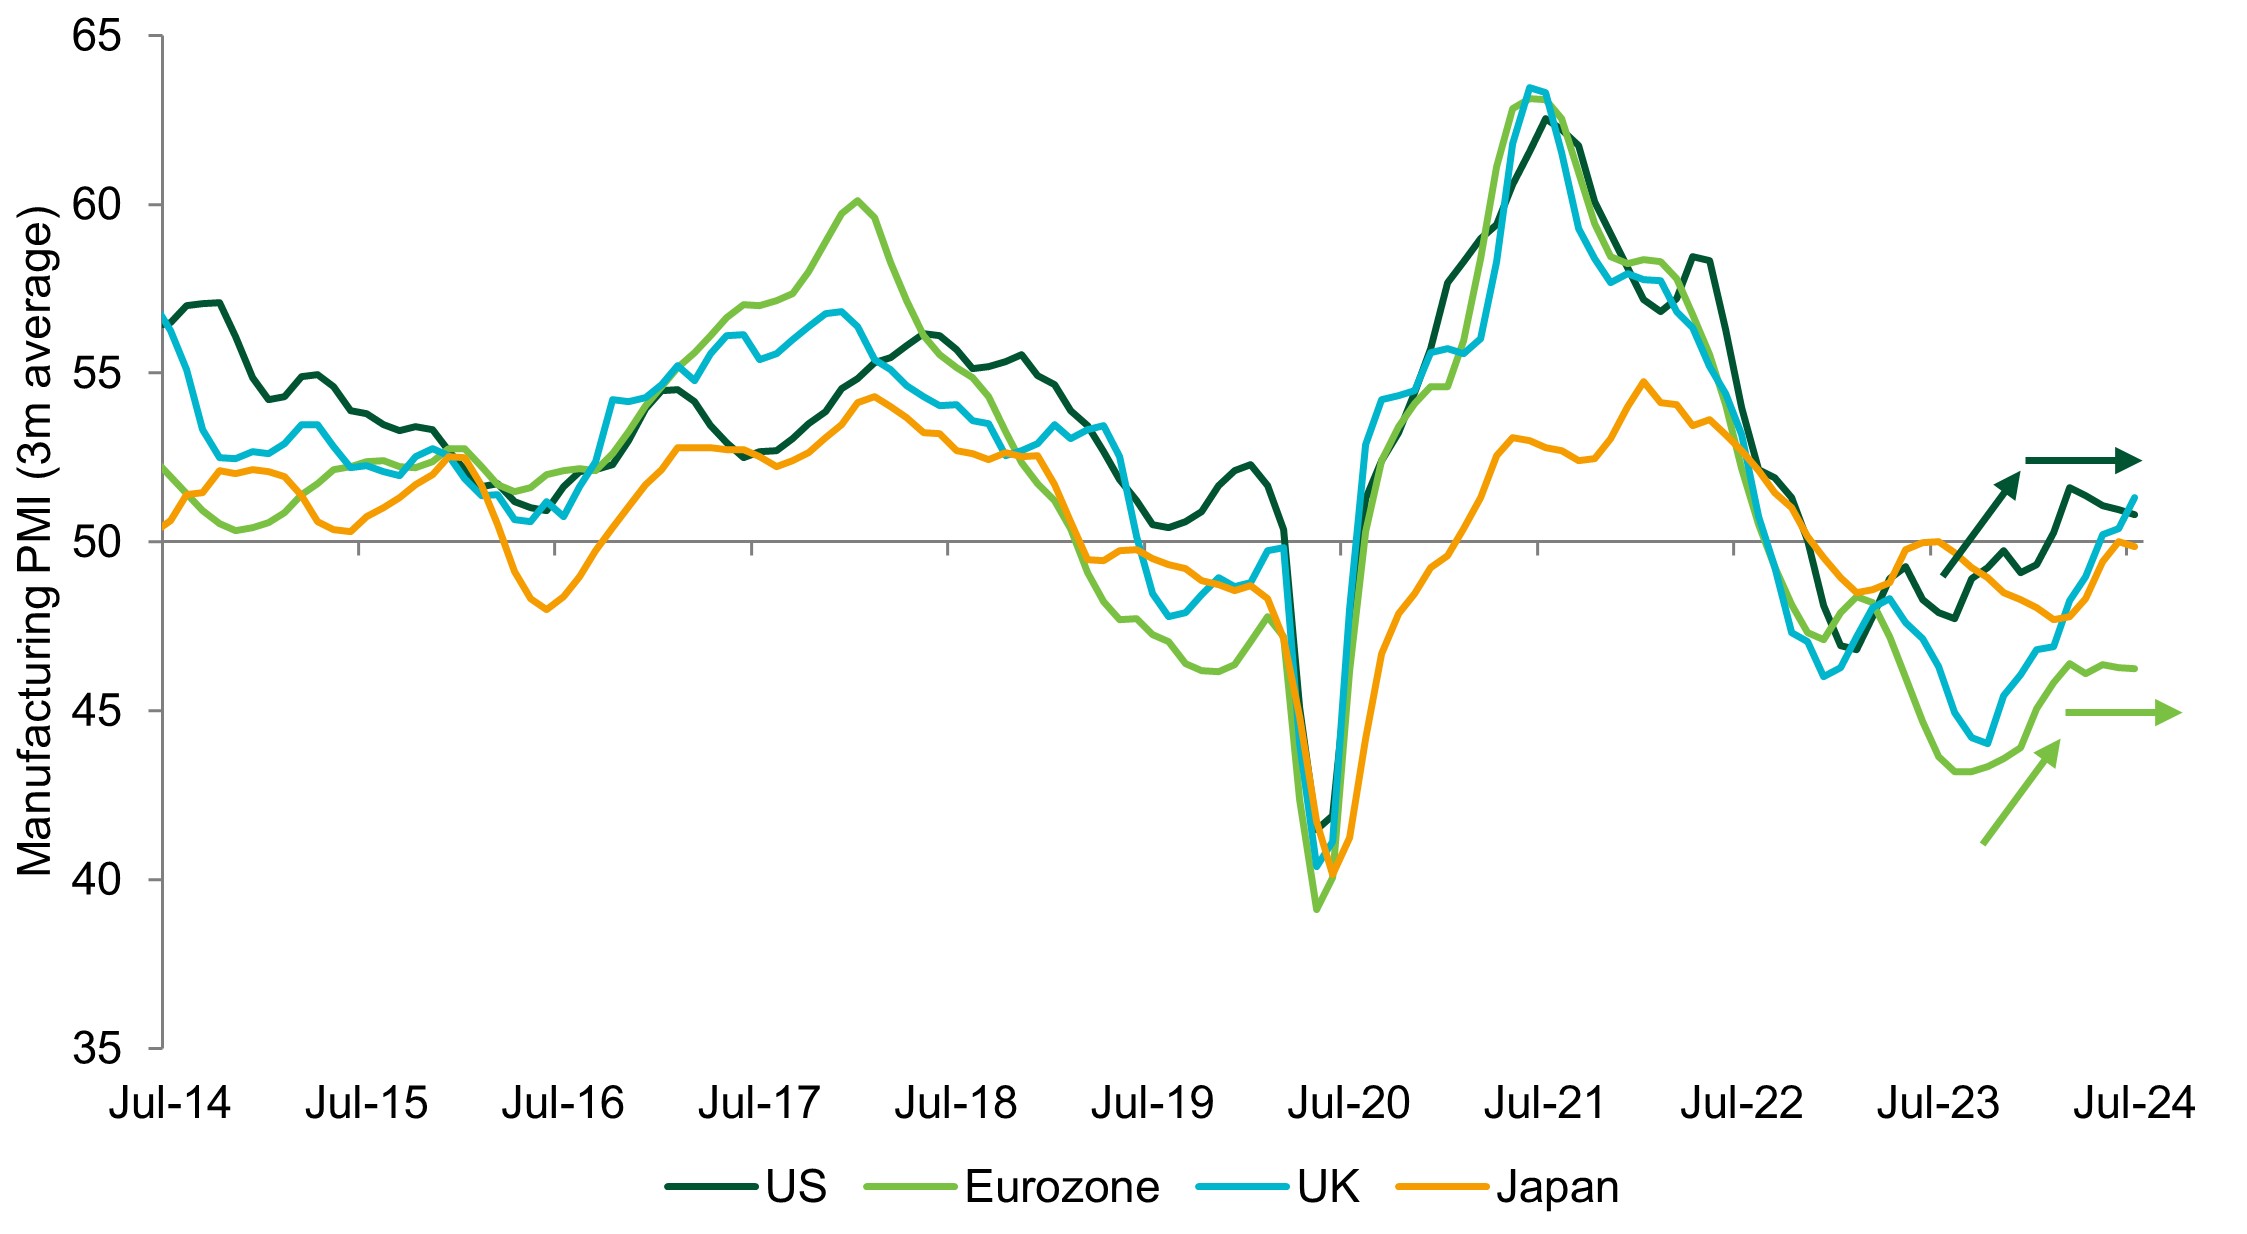
Source: Insight Investment and Bloomberg as at 25 July 2024.
- The rebound in manufacturing PMIs that began in mid-2023 appears to have levelled out in recent months, with eurozone data especially disappointing. While we remain in a stabilising economic regime, it is becoming apparent that the manufacturing sector could benefit from support. Fortunately, a second European Central Bank (ECB) rate cut appears highly likely for September, with other major central banks expected to ease later in the year.
Market watch
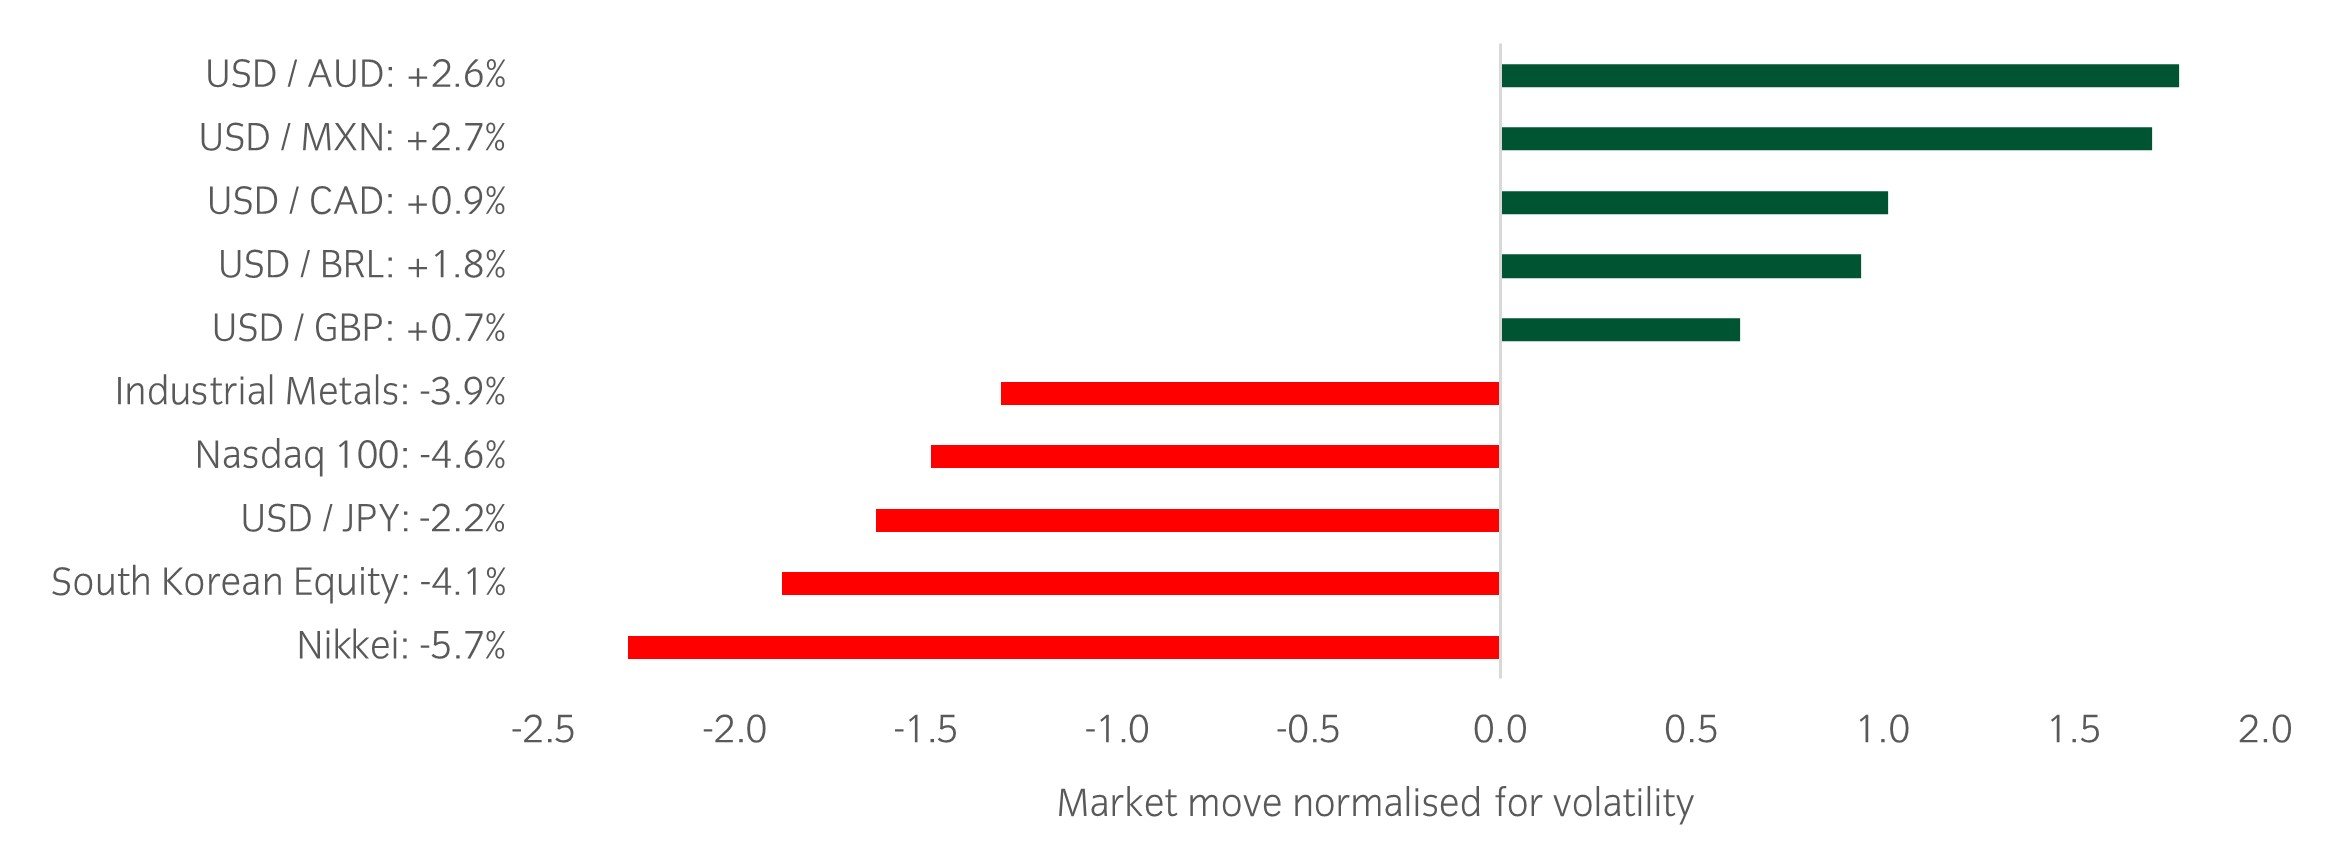
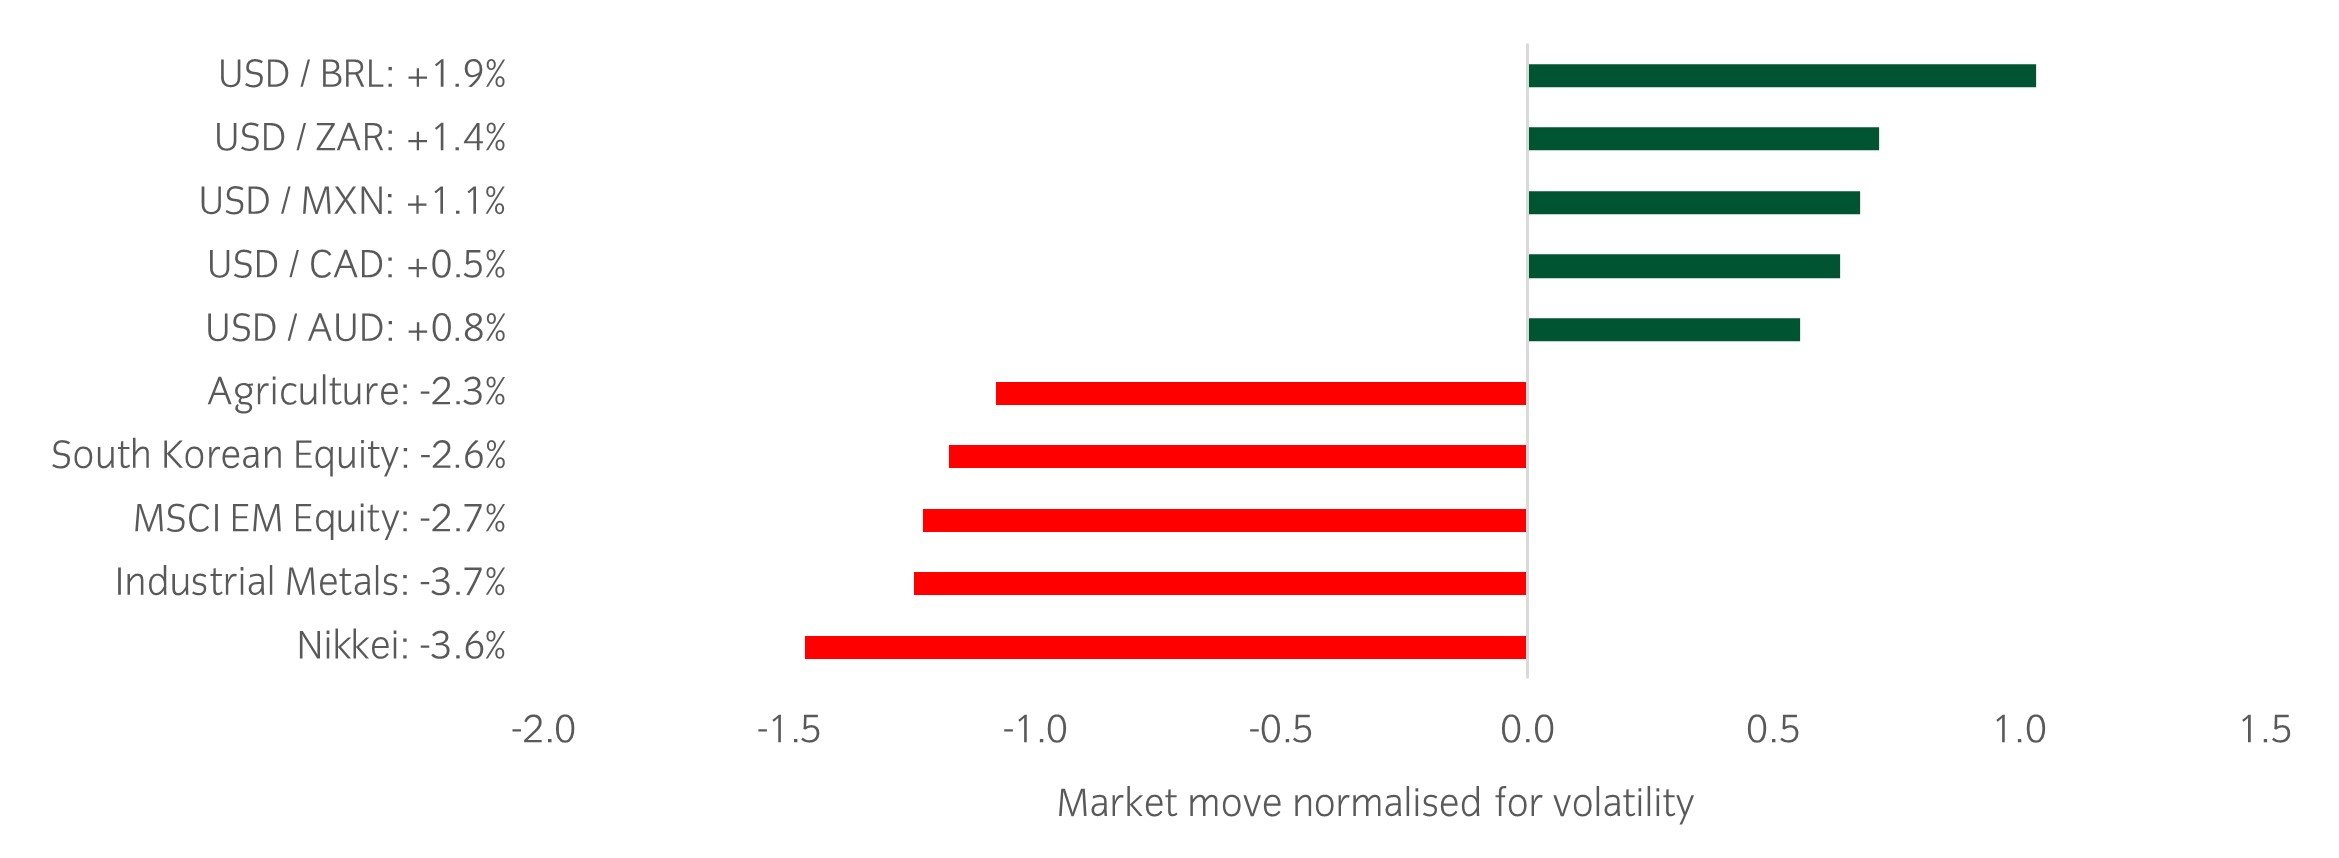
Source: Bloomberg and Insight as at 26 July 2024. The price movement of each asset is shown next to its name. The data used by the bar chart divides the price movement by the annualised historical volatility of each asset.
Over the past week, several things caught our eye:
- The week was dominated by a violent de-risking in equity markets, with YTD winners the major focus of investors' selling, primarily to reduce length and/or secure profits.
- There were plenty of earnings releases, with any signs of negative forward guidance being punished. An emerging trend is the slowdown in discretionary spending, with autos and luxury names suffering most (Tesla -12%, Ford -18%, LVMH -5%, Kering -7%).
- US GDP for the 2nd quarter surprised to the upside (2.8% vs 2% expected), as did personal consumption (2.3% vs 2%), tempering fears of an imminent rollover in growth.
Winners & losers: The US dollar was once again the top performer, with equity markets the big losers. The Nikkei (-5.7%) was driven lower by the continued strength of the yen, with USDJPY briefly hitting 152.
Asset allocation observation
Ongoing earnings divergence between large and small caps
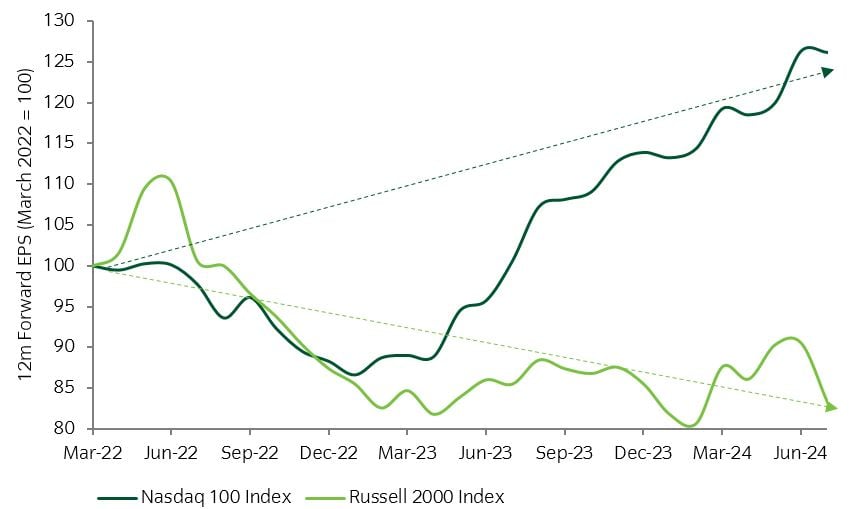
Source: Insight and Bloomberg as at 26 July 2024.
- Despite a significant easing in financial conditions since the last rate hike in the US, small caps earnings are yet to show any signs of a rebound. Consequently, a divergence has emerged between earnings of Nasdaq and Russell 2000 companies.
- Following the market rotation over the past fortnight (Russell > Nasdaq), we believe we could see a reversion back to the longer term trend of large cap outperformance.
Chart of the week
Winners and losers from a potential Trump presidency
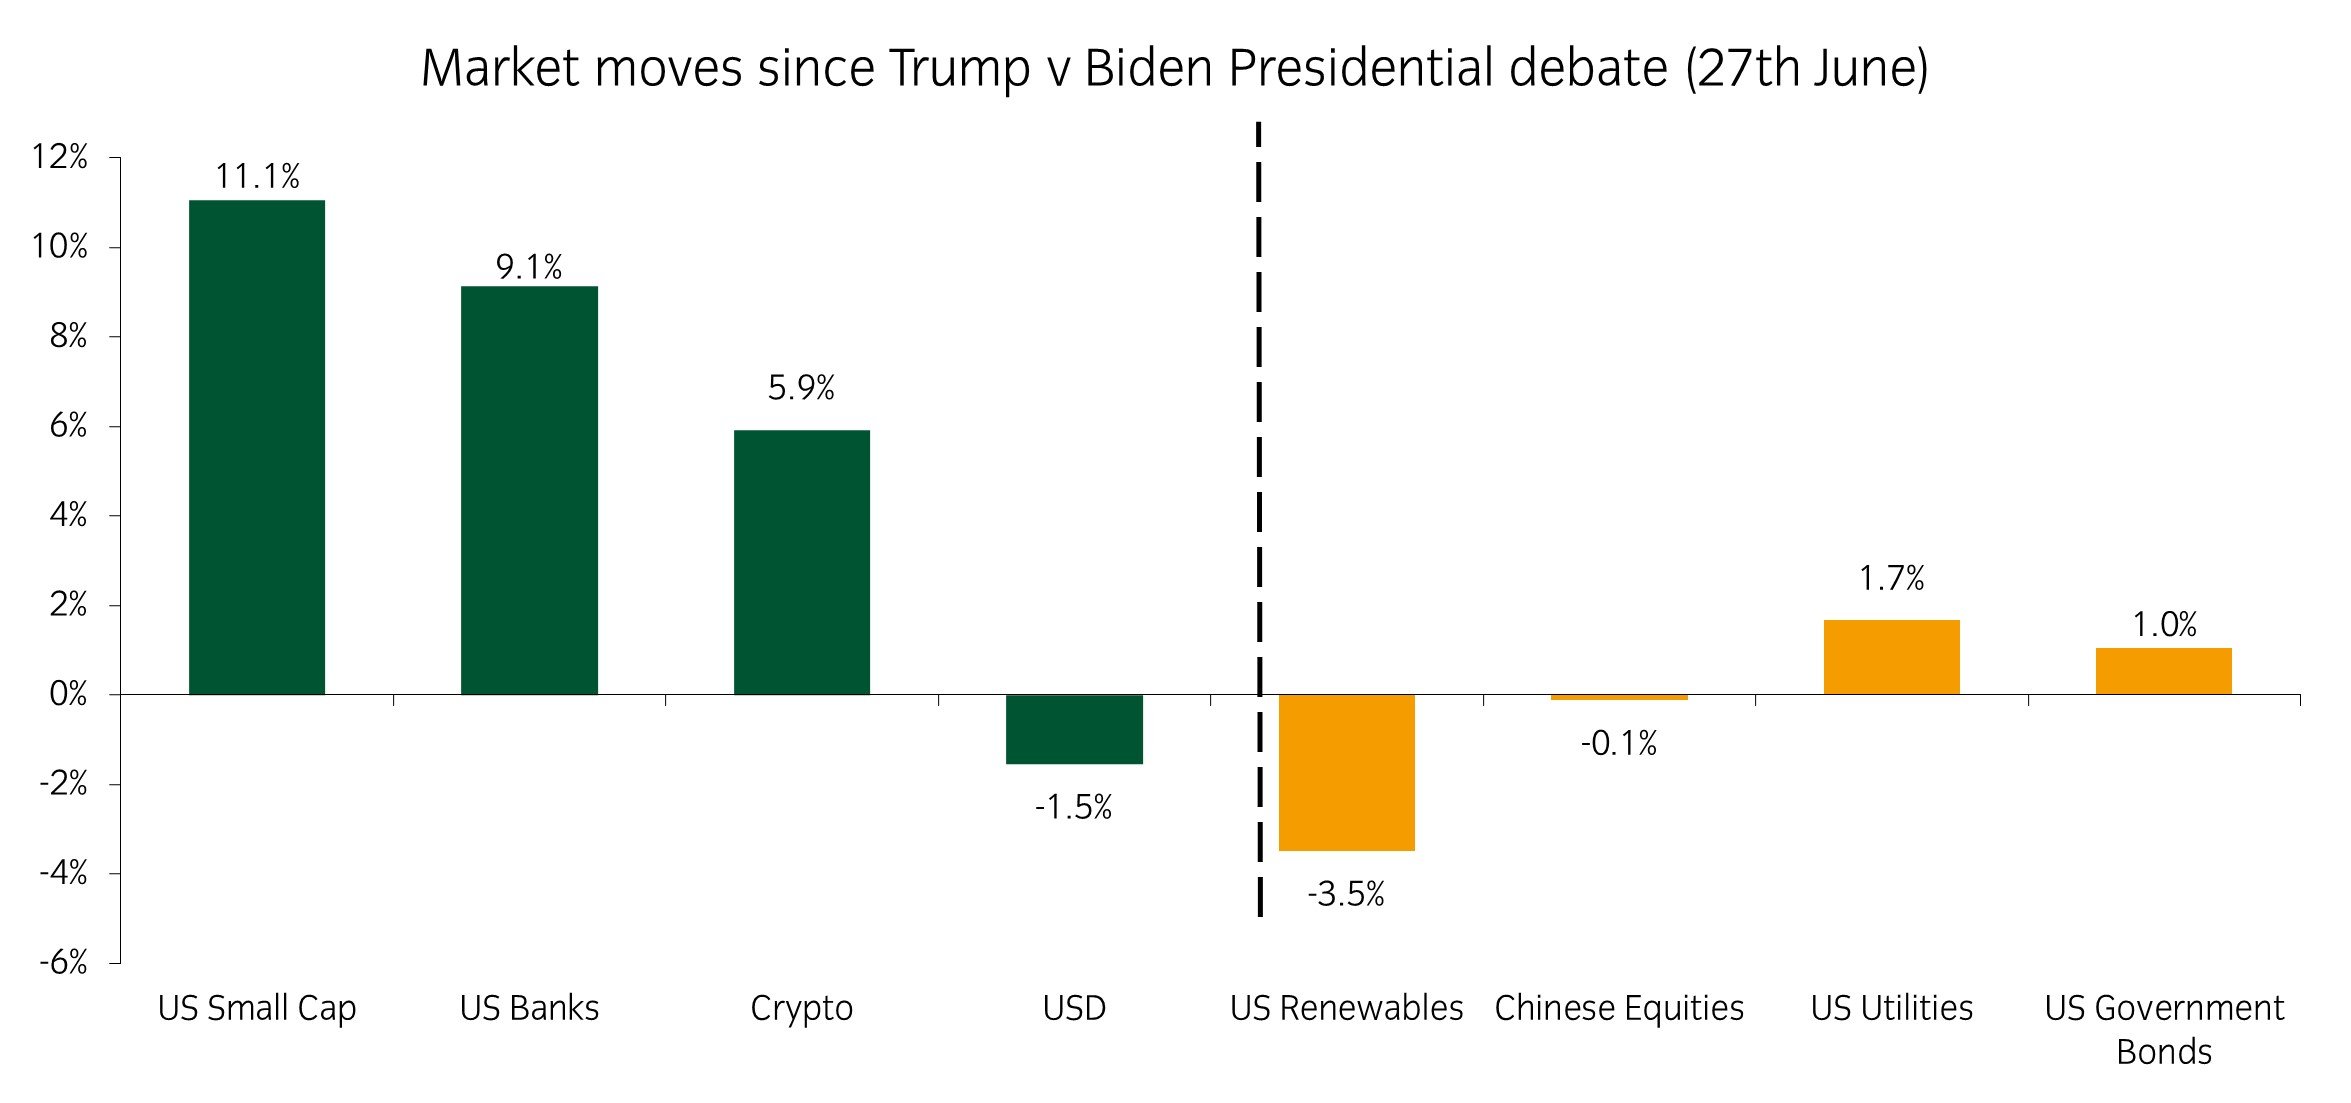
Source: Insight Investment and Bloomberg as at 18 July 2024.
- Despite November still being some months away, markets are already starting to factor in the likely winners and losers from a potential second Trump presidency. The prospect of a significant hike in import tariffs, especially from goods coming from China, is weighing on Chinese equities.
- At the same time, Trump's bias towards de-regulation should benefit banks, but the prospect of reduced subsidies is hurting renewables. There is also a widespread belief that Trump would run even larger fiscal deficits due to tax cuts which would see a bigger supply of US government bonds.
- The clearest outperformer so far has been US small cap equities, which has also benefitted from the fall in short-dated US bond yields triggered by the release of soft US CPI data last week.
Market watch
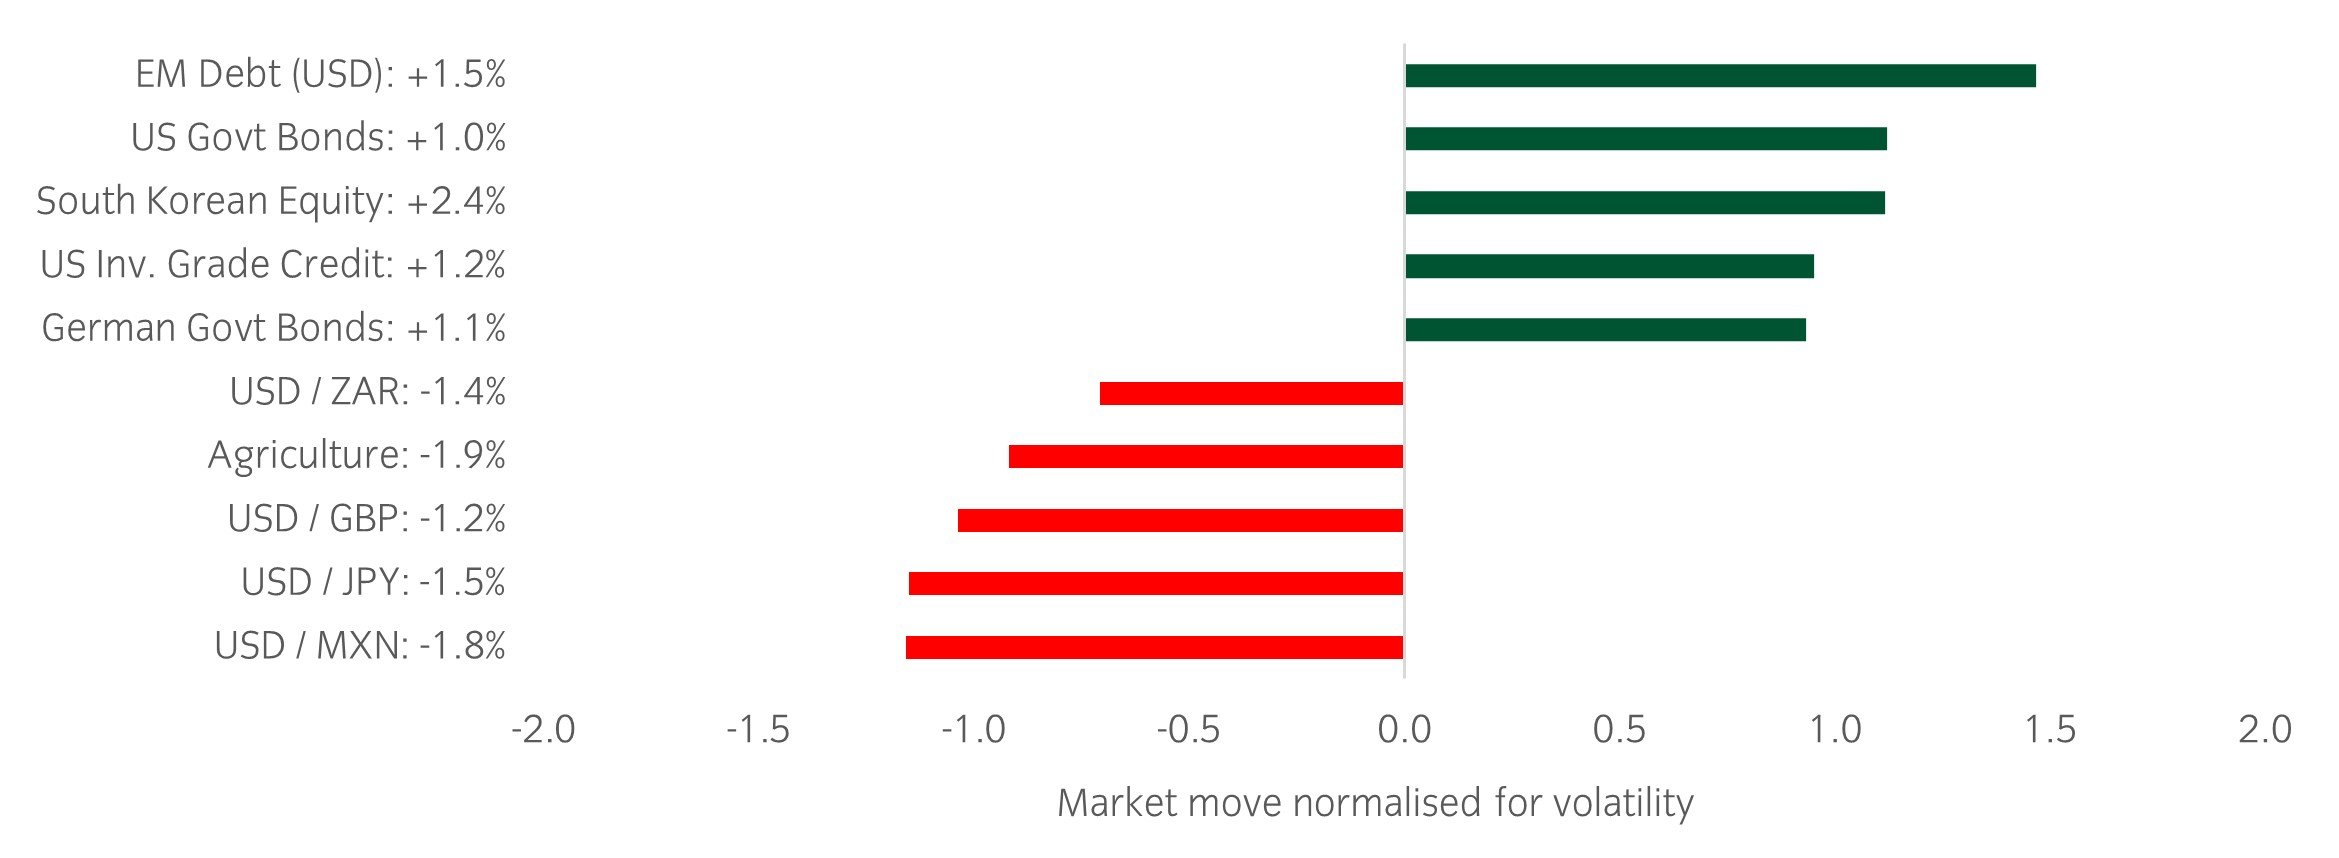
Source: Bloomberg and Insight as at 19 July 2024. The price movement of each asset is shown next to its name. The data used by the bar chart divides the price movement by the annualised historical volatility of each asset.
Over the past week, several things caught our eye:
- Political noise added to equity volatility and played a hand in some of the rotation within markets. The impact of a higher likelihood of a Trump presidency has been discussed in our chart of the week above, but Biden’s comments on the need for stricter trade restrictions around semiconductor exports to China led the Philadelphia Semiconductor Index to its worst daily return since 2020 on Tuesday (-6.8%). In sympathy, implied volatility has reached April highs.
- Taiwan Semiconductor Manufacturing Company (TSMC) reported a strong set of results on Thursday, beating both profit and margin expectations and raising guidance for 3rd quarter sales. While this is a positive lead indicator for the rest of the AI exposed market, recent outstanding performance and heightened concerns over trade restrictions means the initial reaction has been very muted.
- US retail sales and industrial production numbers for June came in stronger than expected. Some US growth data has been on the softer side recently, so this latest data suggests it is too early to conclude a cyclical slowdown is underway.
Winners & losers: The US dollar has been the outperformer, recovering a small amount from what has been a weak month. On the other side, Asian equities underperformed with the Nikkei leading losses.
Asset allocation observation
Weak retail sales in china weighs on inflation
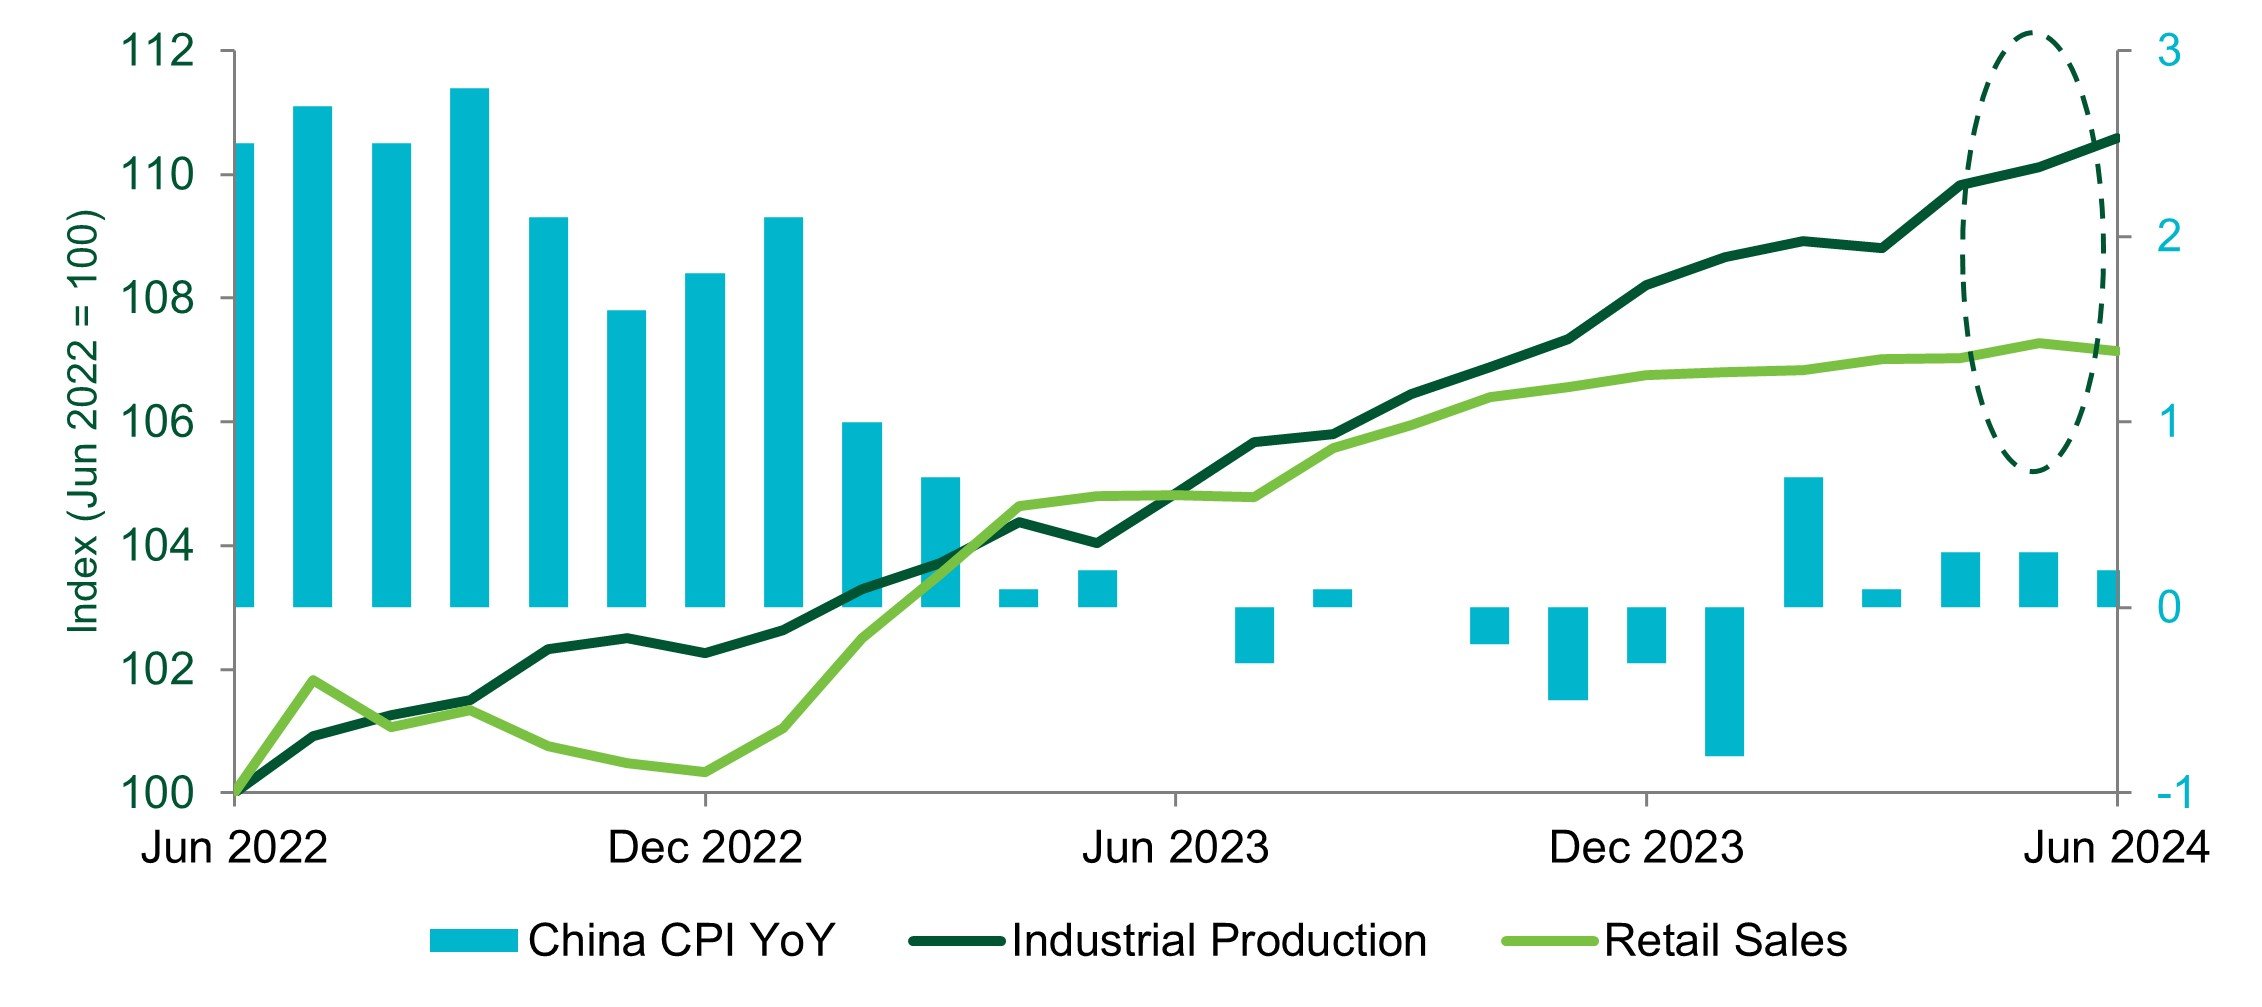
Source: Insight and Bloomberg as at 19 July 2024.
- While industrial production in China remains firm, retail sales have flatlined in 2024 as the economy continues to stumble in the post-Covid world.
- Weak consumer demand helps explain why China is one of the few countries in the world where inflation is significantly below target.
Chart of the week
US earnings growth, the next big catalyst for stocks?
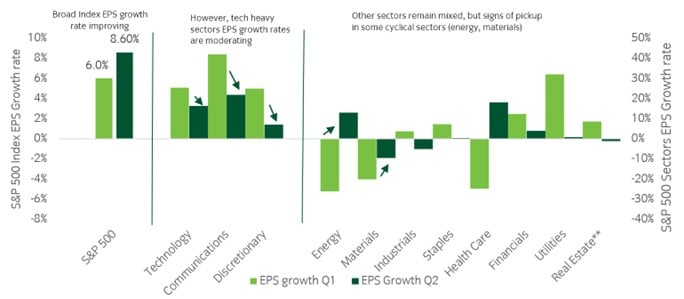
Source: Insight Investment and Bloomberg as at 12 July 2024.
- The next big catalyst for stocks is likely to come from the Q2 earnings season. Expectations for the US stock market are for growth in profits of +8.6% (year on year), which would mark a sequential improvement from the Q1 growth rate of +6%.
- This week’s chart highlights that a broadening out in contribution from sectors is expected. Last quarter the mega-caps generated the bulk of the earnings growth, while other sectors’ EPS growth was essentially flat.
- It is anticipated that earnings from tech-heavy sectors will moderate slightly from the lofty levels seen in the past few quarters. This will be more than offset from a pickup from other sectors, particularly those with a cyclical tilt.
- Healthier breadth in earnings growth is likely to be key to the sustainability of the equity rally.
Market watch
Source: Bloomberg and Insight as at 12 July 2024.The price movement of each asset is shown next to its name. The data used by the bar chart divides the price movement by the annualised historical volatility of each asset.
Over the past week, several things caught our eye:
- The highlight of the week was Thursday’s US CPI print, which came in below expectations, triggering a rally in short-term Treasuries and rate-sensitive equities.
- The Japanese yen strengthened sharply on Thursday, indicating potential intervention by the Bank of Japan to the value of around Y3.5 trillion.
- Concerns about President Biden’s ability to run as the Democratic candidate in this year’s US election continued. However, at this stage he remains steadfast in his commitment to be the Democrat nominee.
Winners & losers: Softer inflation and growth numbers meant fixed income led performance this week, while the US dollar underperformed.
Asset allocation observation
Continued progress on inflation
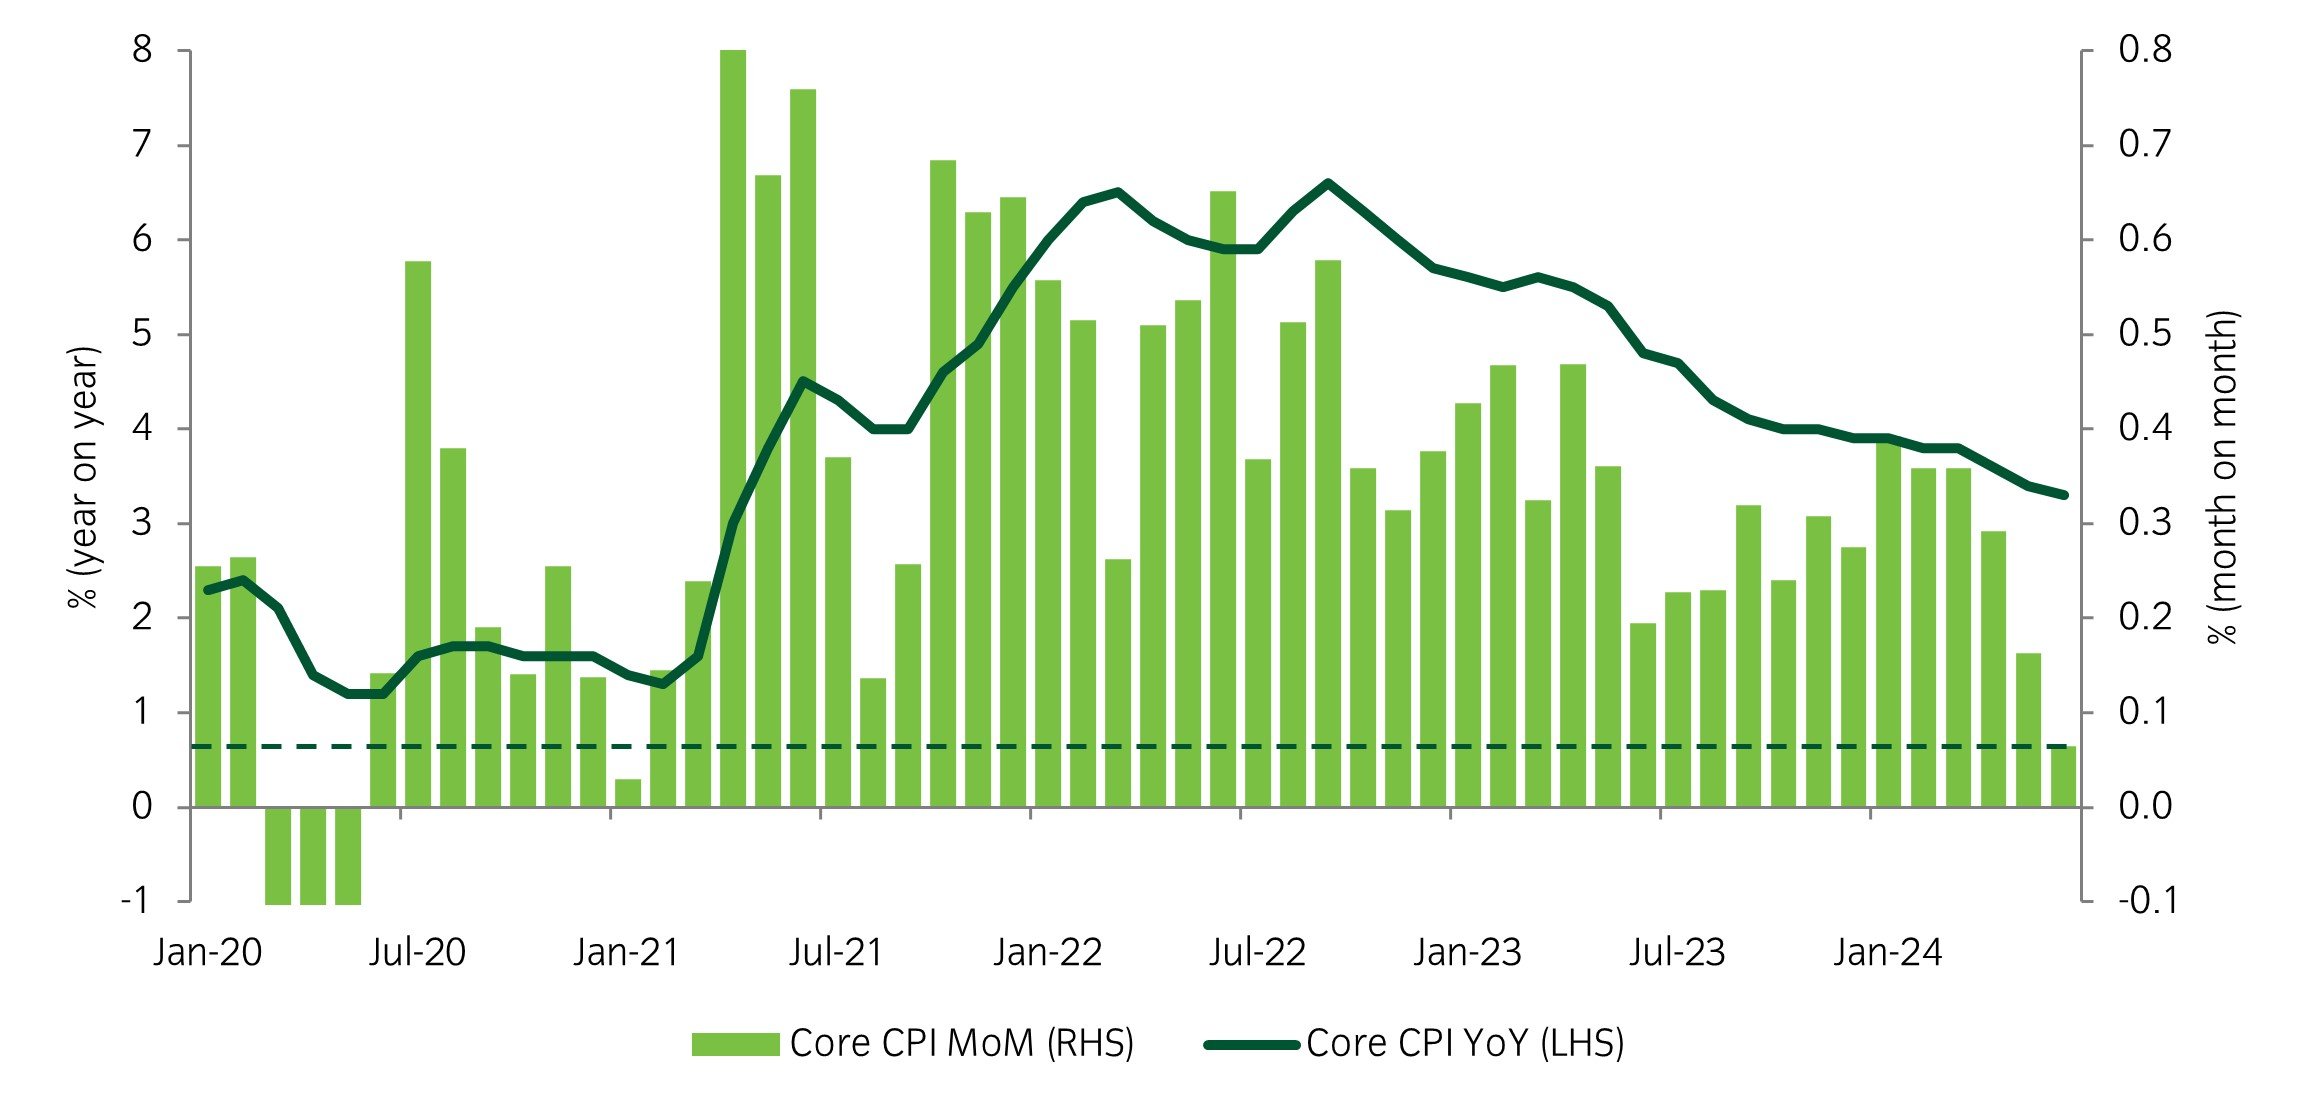
Source: Insight and Bloomberg as at 12 July 2024.
- June marked another month of improvement to the US inflation picture, with the lowest monthly change in core CPI since January 2021. Markets now believe this gives ample latitude for the Federal Reserve to begin cutting rates at its September meeting, with a further 25 basis point cut expected by year-end.
- We expect this backdrop to be broadly supportive for risk assets, assuming that the growth picture remains resilient.
Chart of the week
Equity market breadth was narrow in the 2nd quarter
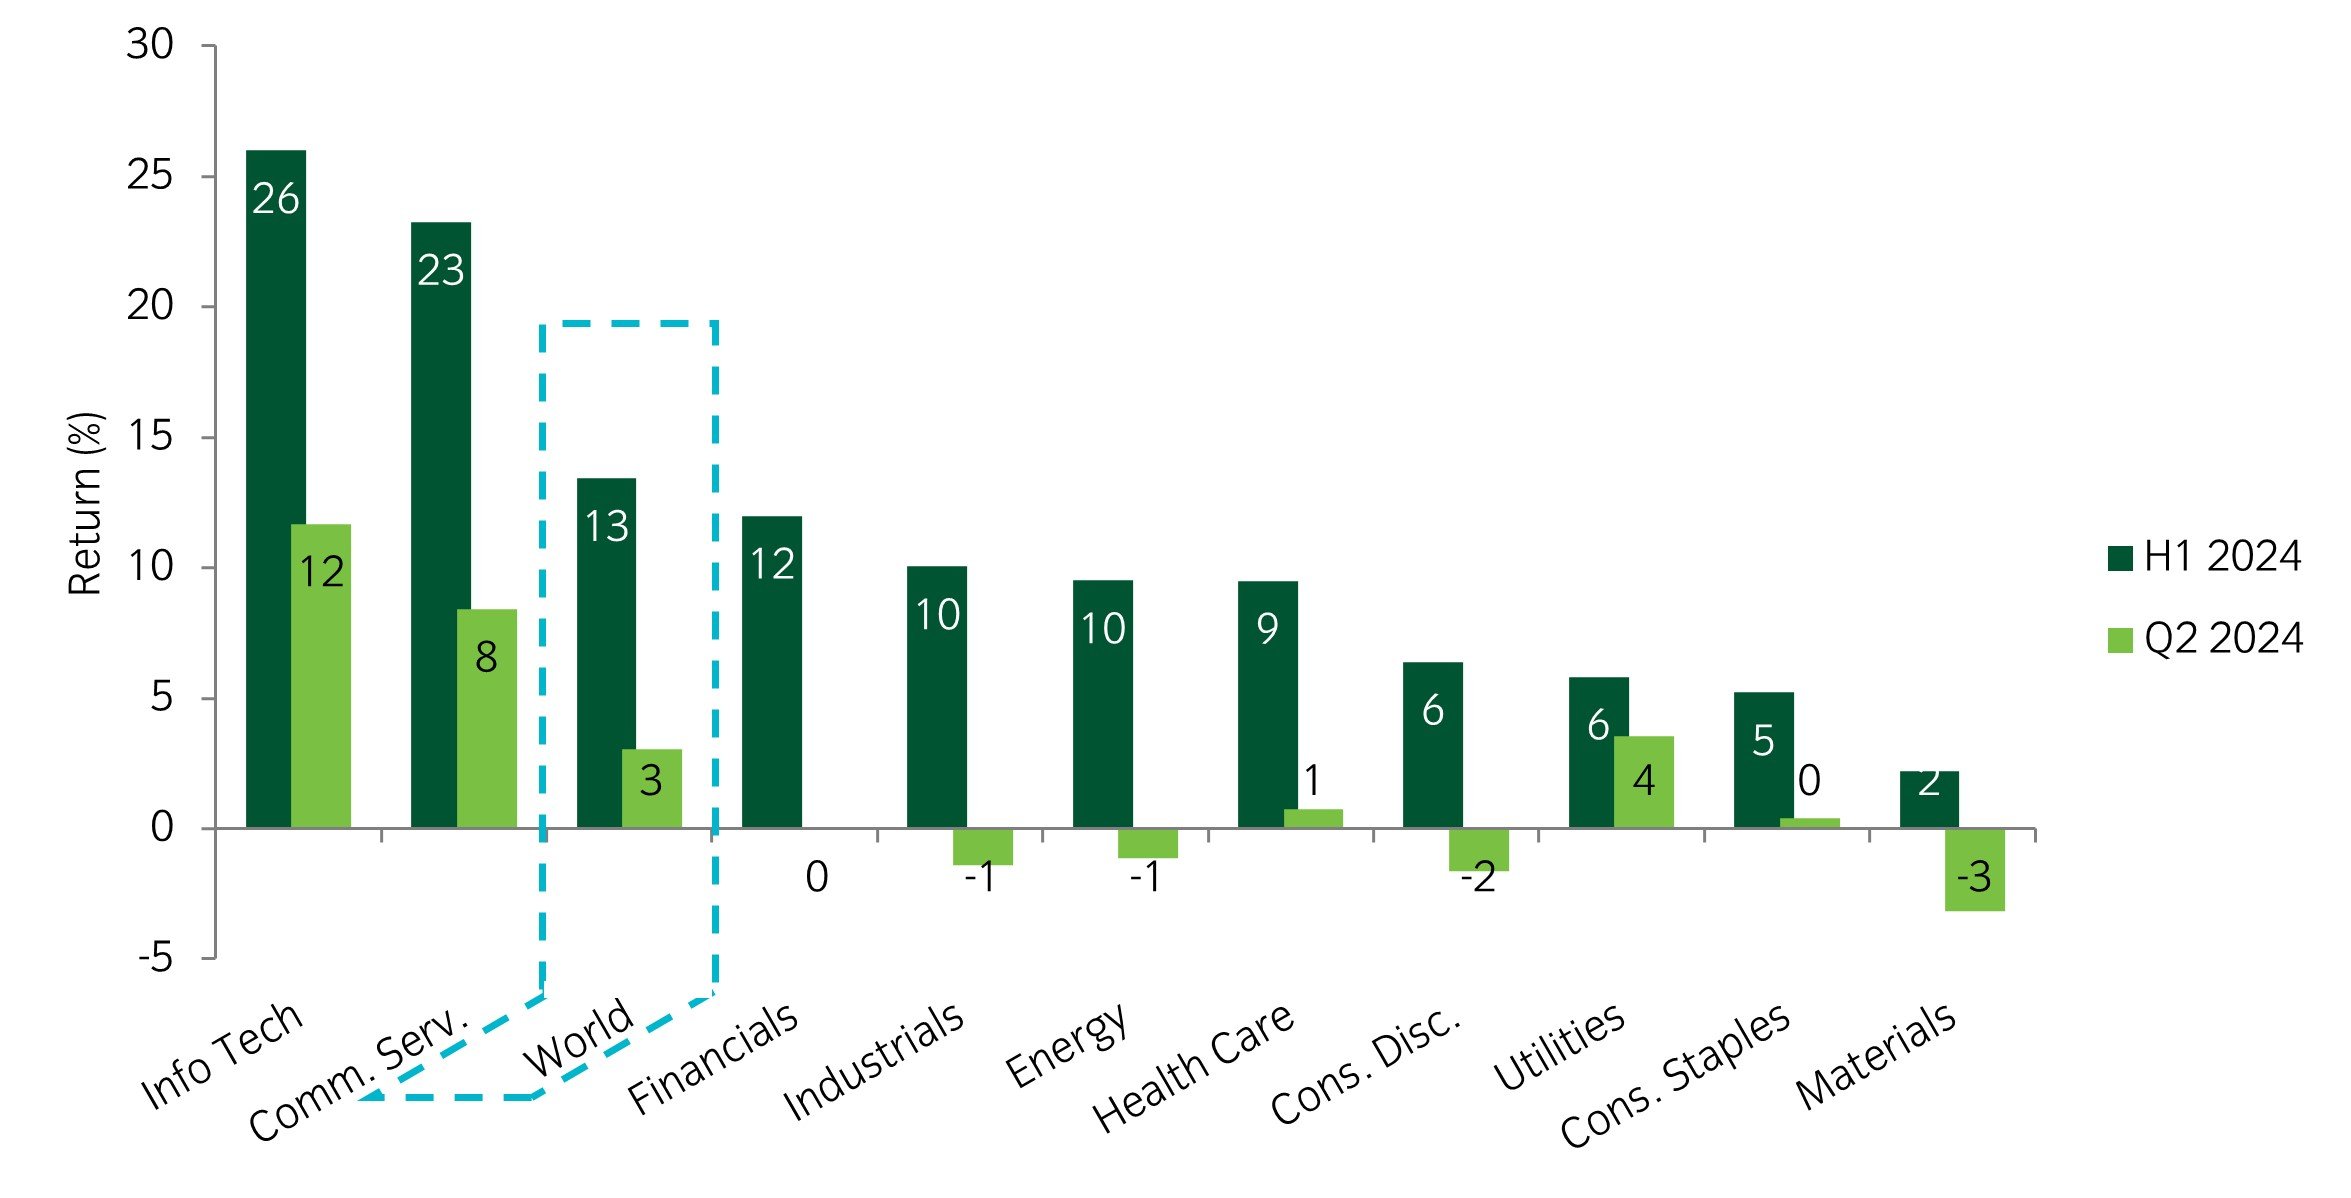
Source: Insight Investment and Bloomberg as at 5 July 2024.
-
Global equities rose in Q2, but this was mostly driven by only two sectors (Information Technology and Communication Services). In fact, the percentage of companies in the index whose price is above their 100-day moving average fell during Q2 from 80% to just above 50%. The forthcoming earnings season will give a sense of whether the index laggards will be able to pick up some of the slack.
Market watch
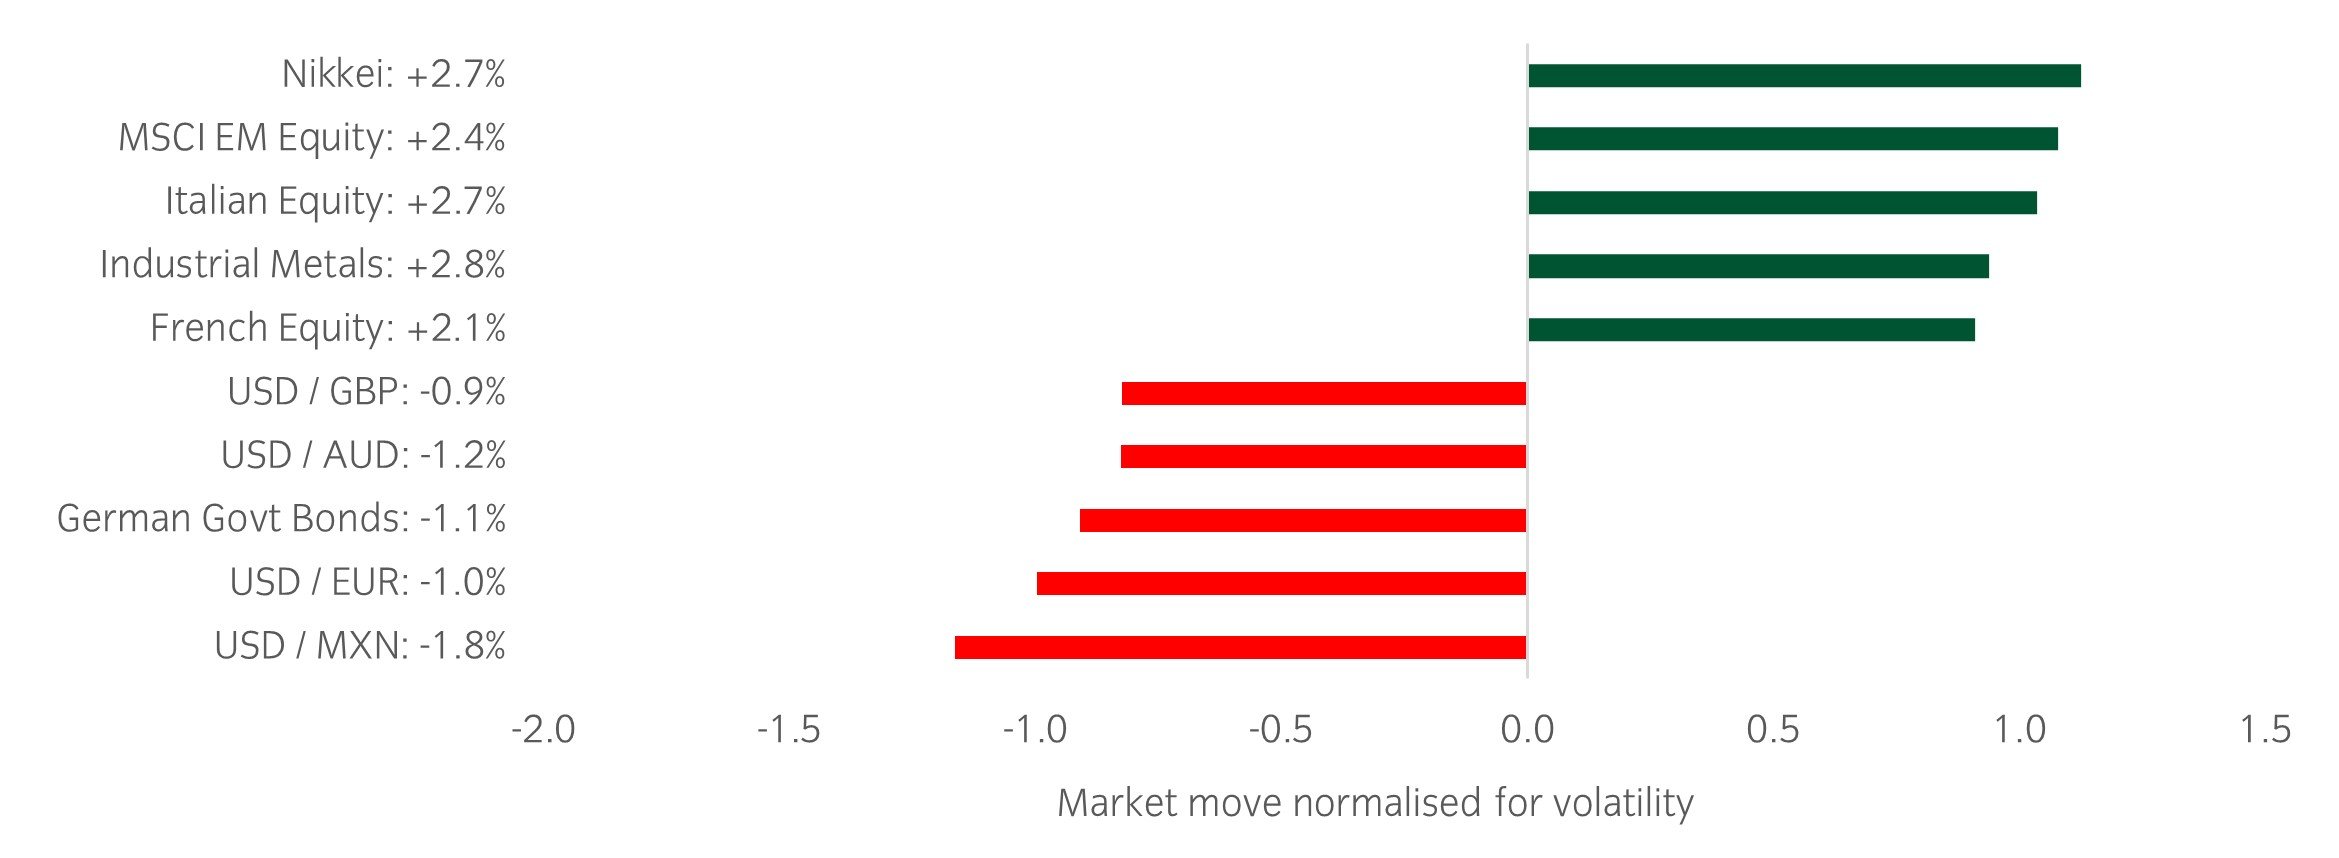
Source: Bloomberg and Insight as at 5 July 2024. The price movement of each asset is shown next to its name. The data used by the bar chart divides the price movement by the annualised historical volatility of each asset.
Over the past week, several things caught our eye:
- A slew of PMI data was released, with marginally weaker numbers on a one-month view. The US ISM Manufacturing PMI fell marginally to 48.5, although there was a pickup in the orders to inventories ratio, which is typically a leading indicator for that series. Globally, manufacturing remained in expansionary territory at 50.9.
- The news flow surrounding the French election was taken as broadly positive this week, which helped the Franco-German bond spread tighten by 14bp. This meant it has now retraced around half of the widening that followed the initial reaction.
- The US labour market added 206k jobs in June, slightly above expectations. The market viewed it as a slightly soft report as there were downward revisions to prior data and an uptick in the unemployment rate to 4.1%.
Winners & losers: Equity markets led returns over the week, with Japan, emerging markets, and Europe outperforming. On the other side, the US dollar weakened following signs of potentially slowing growth.
Asset allocation observation
Manufacturing output trending higher
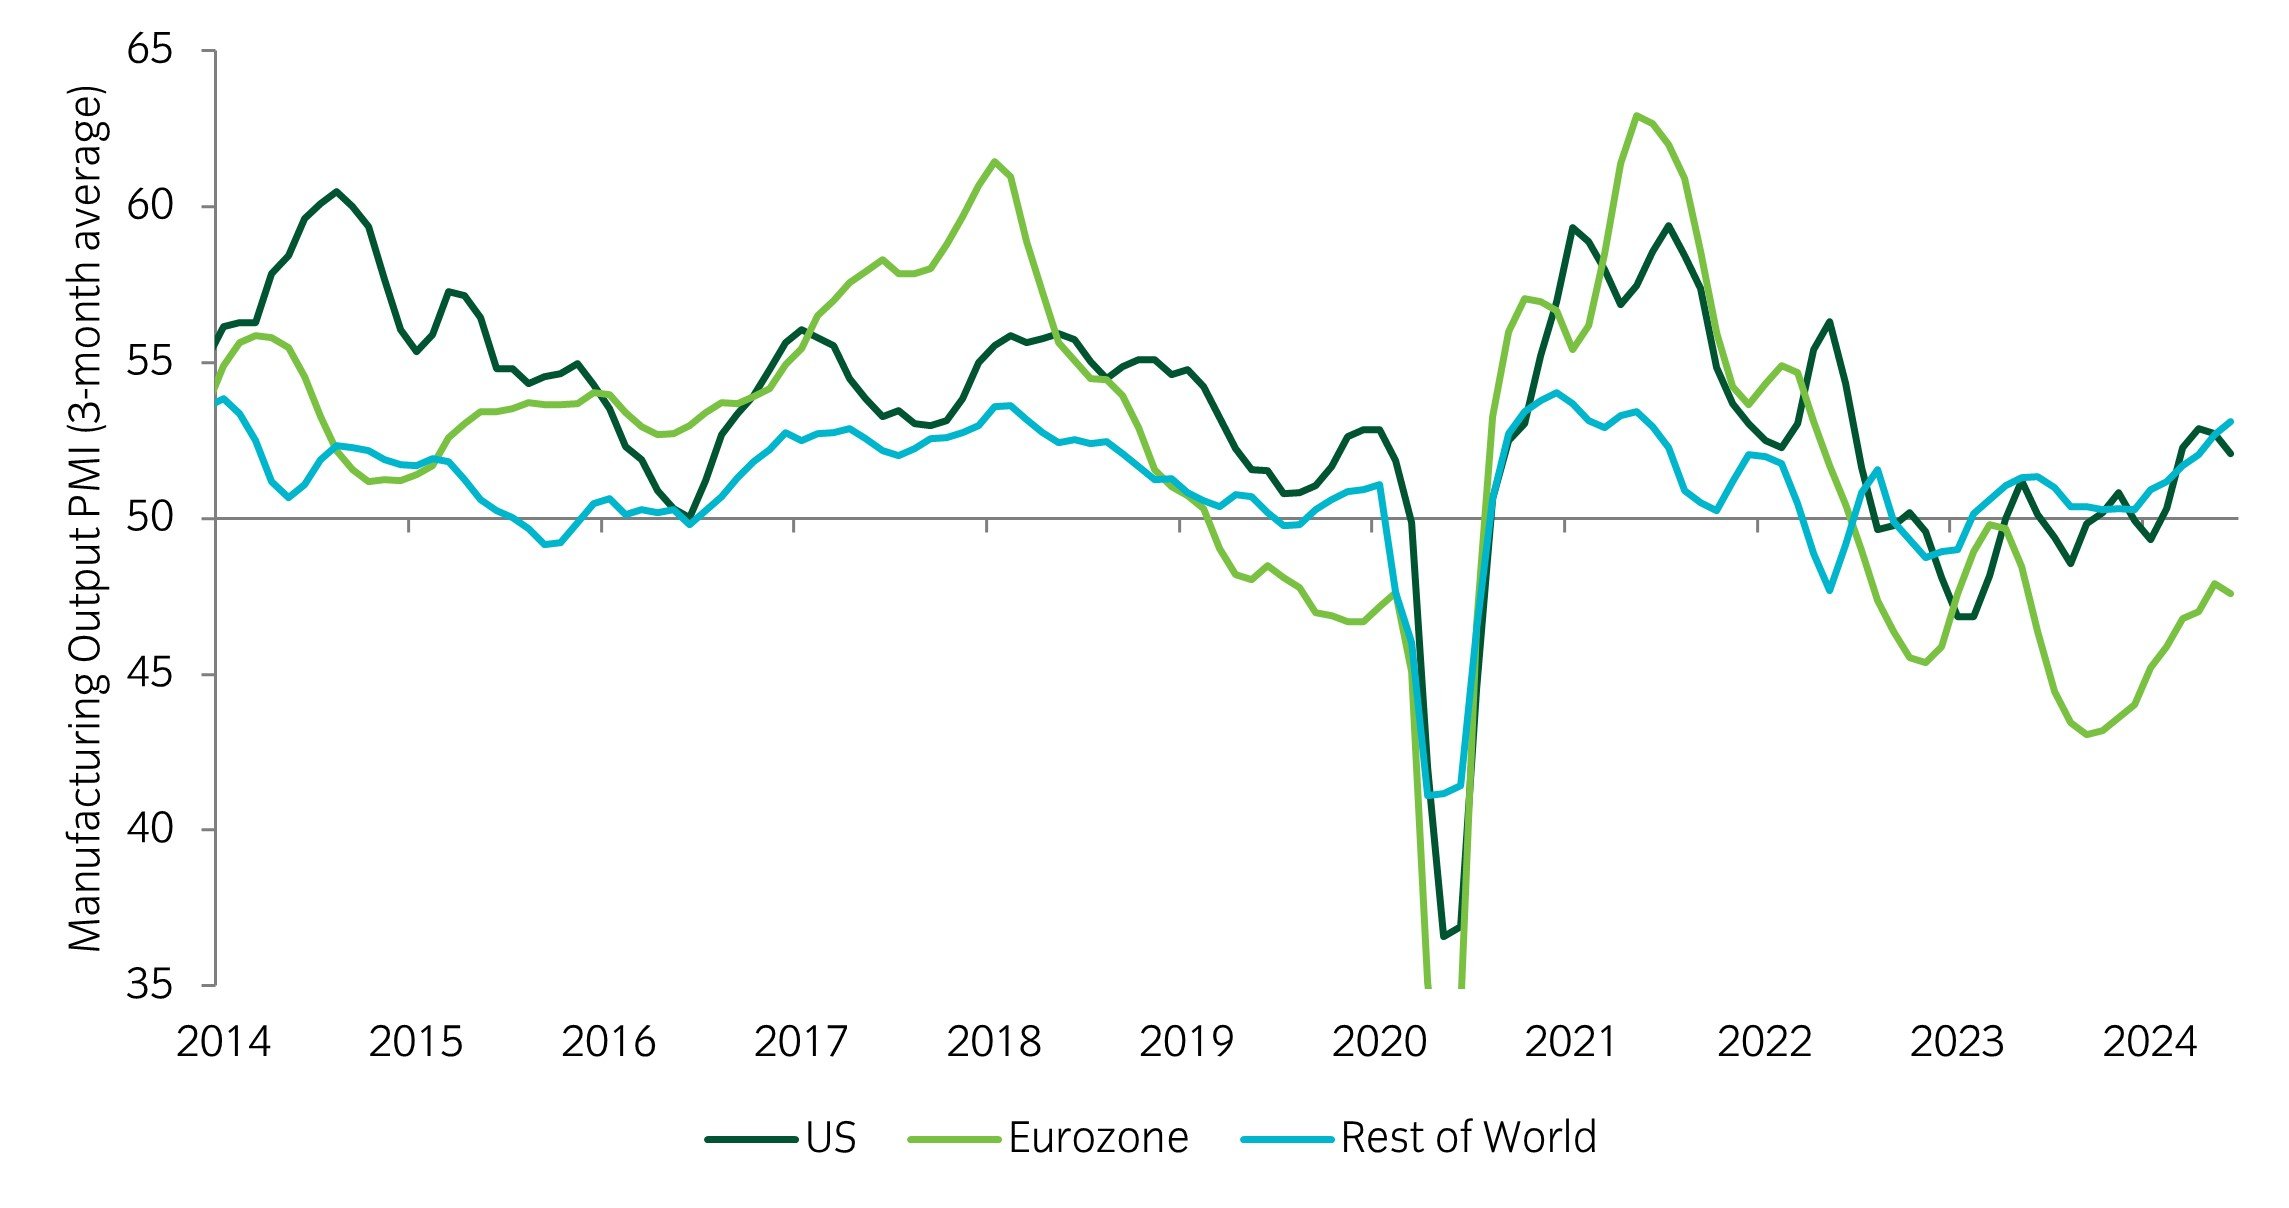
Source: Insight and Bloomberg as at 5 July 2024.
- The recent improvement in manufacturing output shown above is certainly not smooth, but a continuation of this trend would be supportive for risk assets. Data series are always noisy on a month-by-month basis, but the upward trend appears intact.
- Against this backdrop, we maintain our above average levels of cyclical risk, while also keeping our option exposures defensive in the event of a mild pullback.
Most read
Currency

January 2024
Currency quarterly: Q4 2023
Global macro

January 2022
Asset allocation, growth and inflation cycles
Global macro, Currency

June 2023
Global macro research: 30 years in currency markets
Global macro, Fixed income

October 2023