Chart of the week
Market reaction to Trump’s victory - US vs. rest of the world
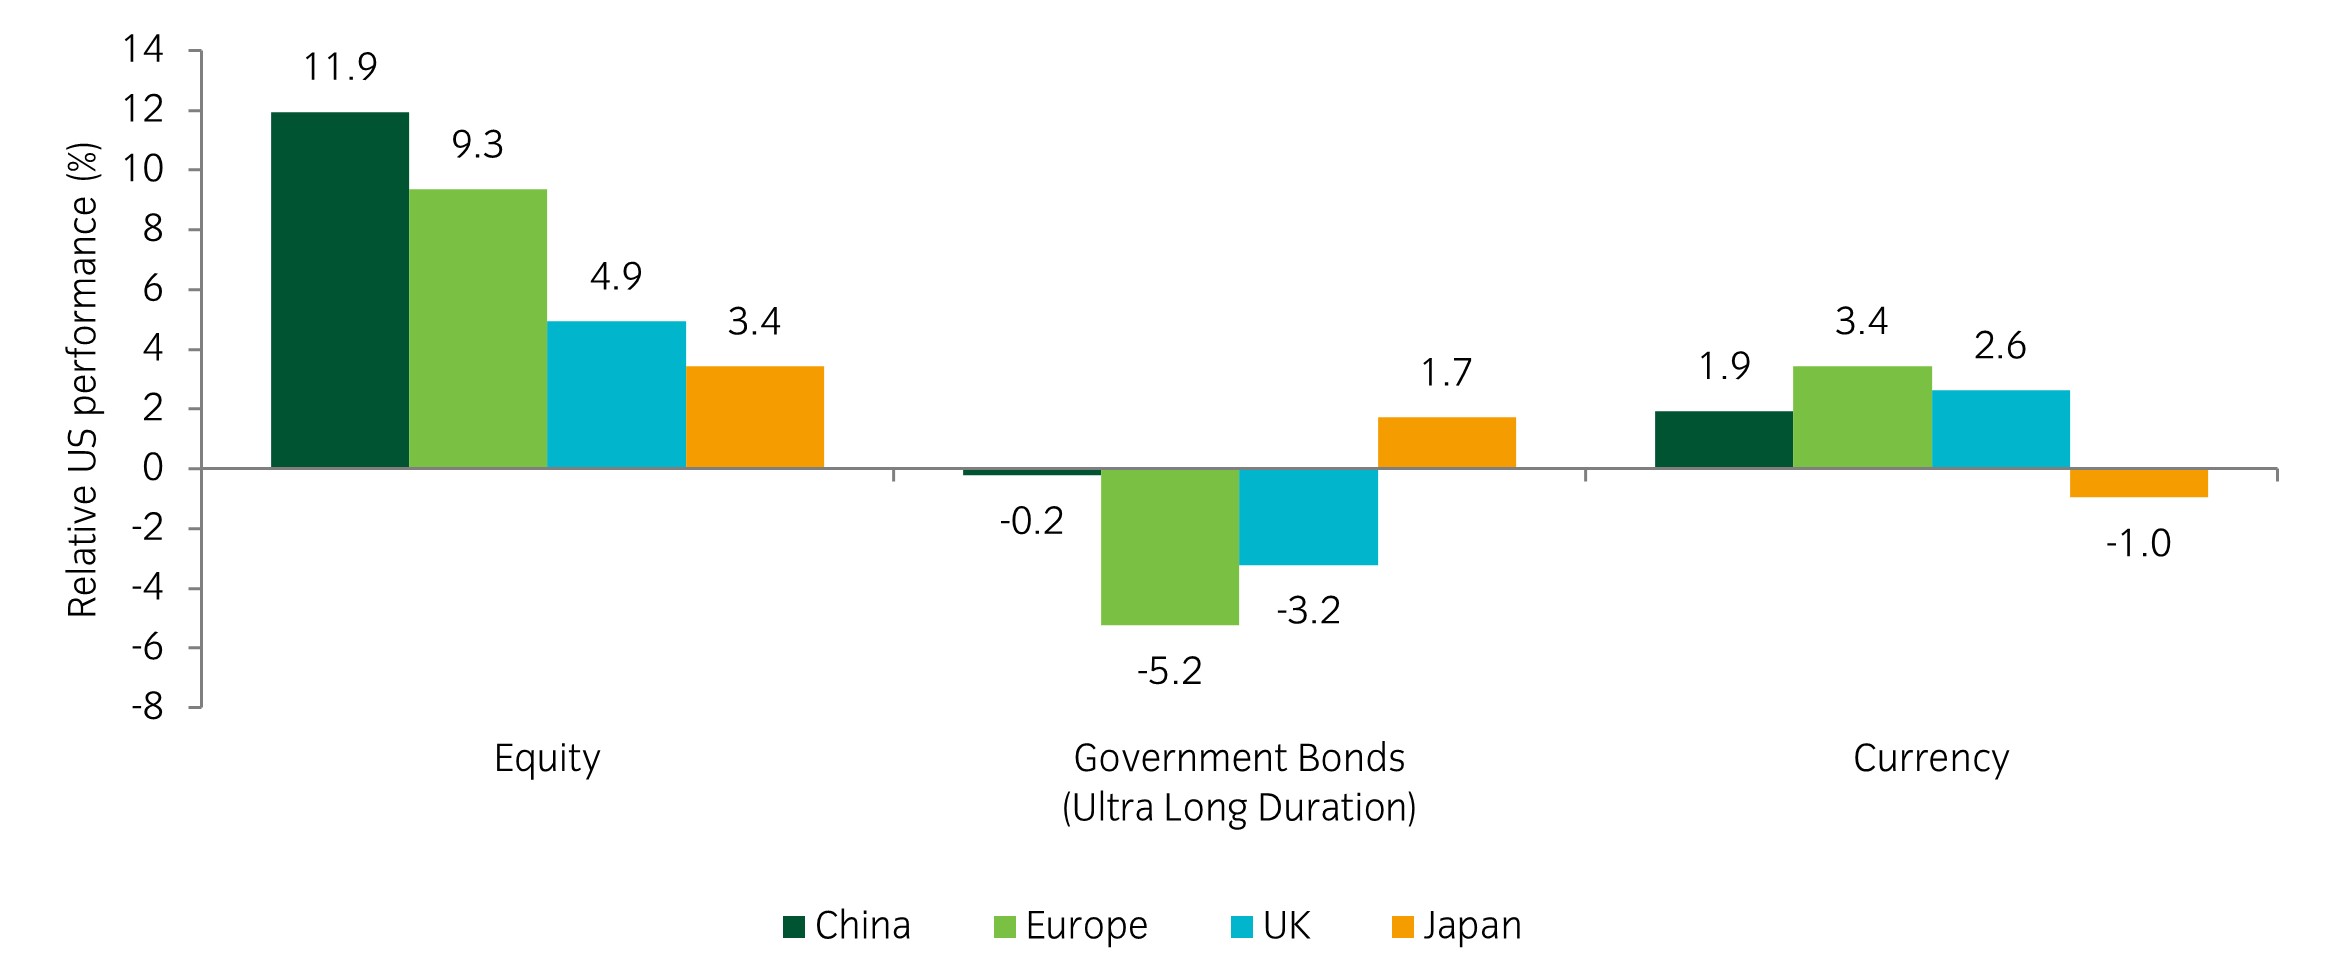
Source: Insight Investment and Bloomberg as at 29 November 2024.
- It's been just over three weeks since the US election and clear trends have emerged in the market’s reaction. US equities have performed strongly, alongside a strengthening USD and rising US Treasury yields. In terms of global equities, the two largest relative underperformers have been China and Europe; largely down to fears of increased tariffs from the incoming administration. This is all occurring as policy makers in China and Europe are concerned about sub-par growth in their economies.
- In our portfolios, we maintain an overweight US vs Europe equity position, alongside a duration composition that favours German bunds over US Treasuries.
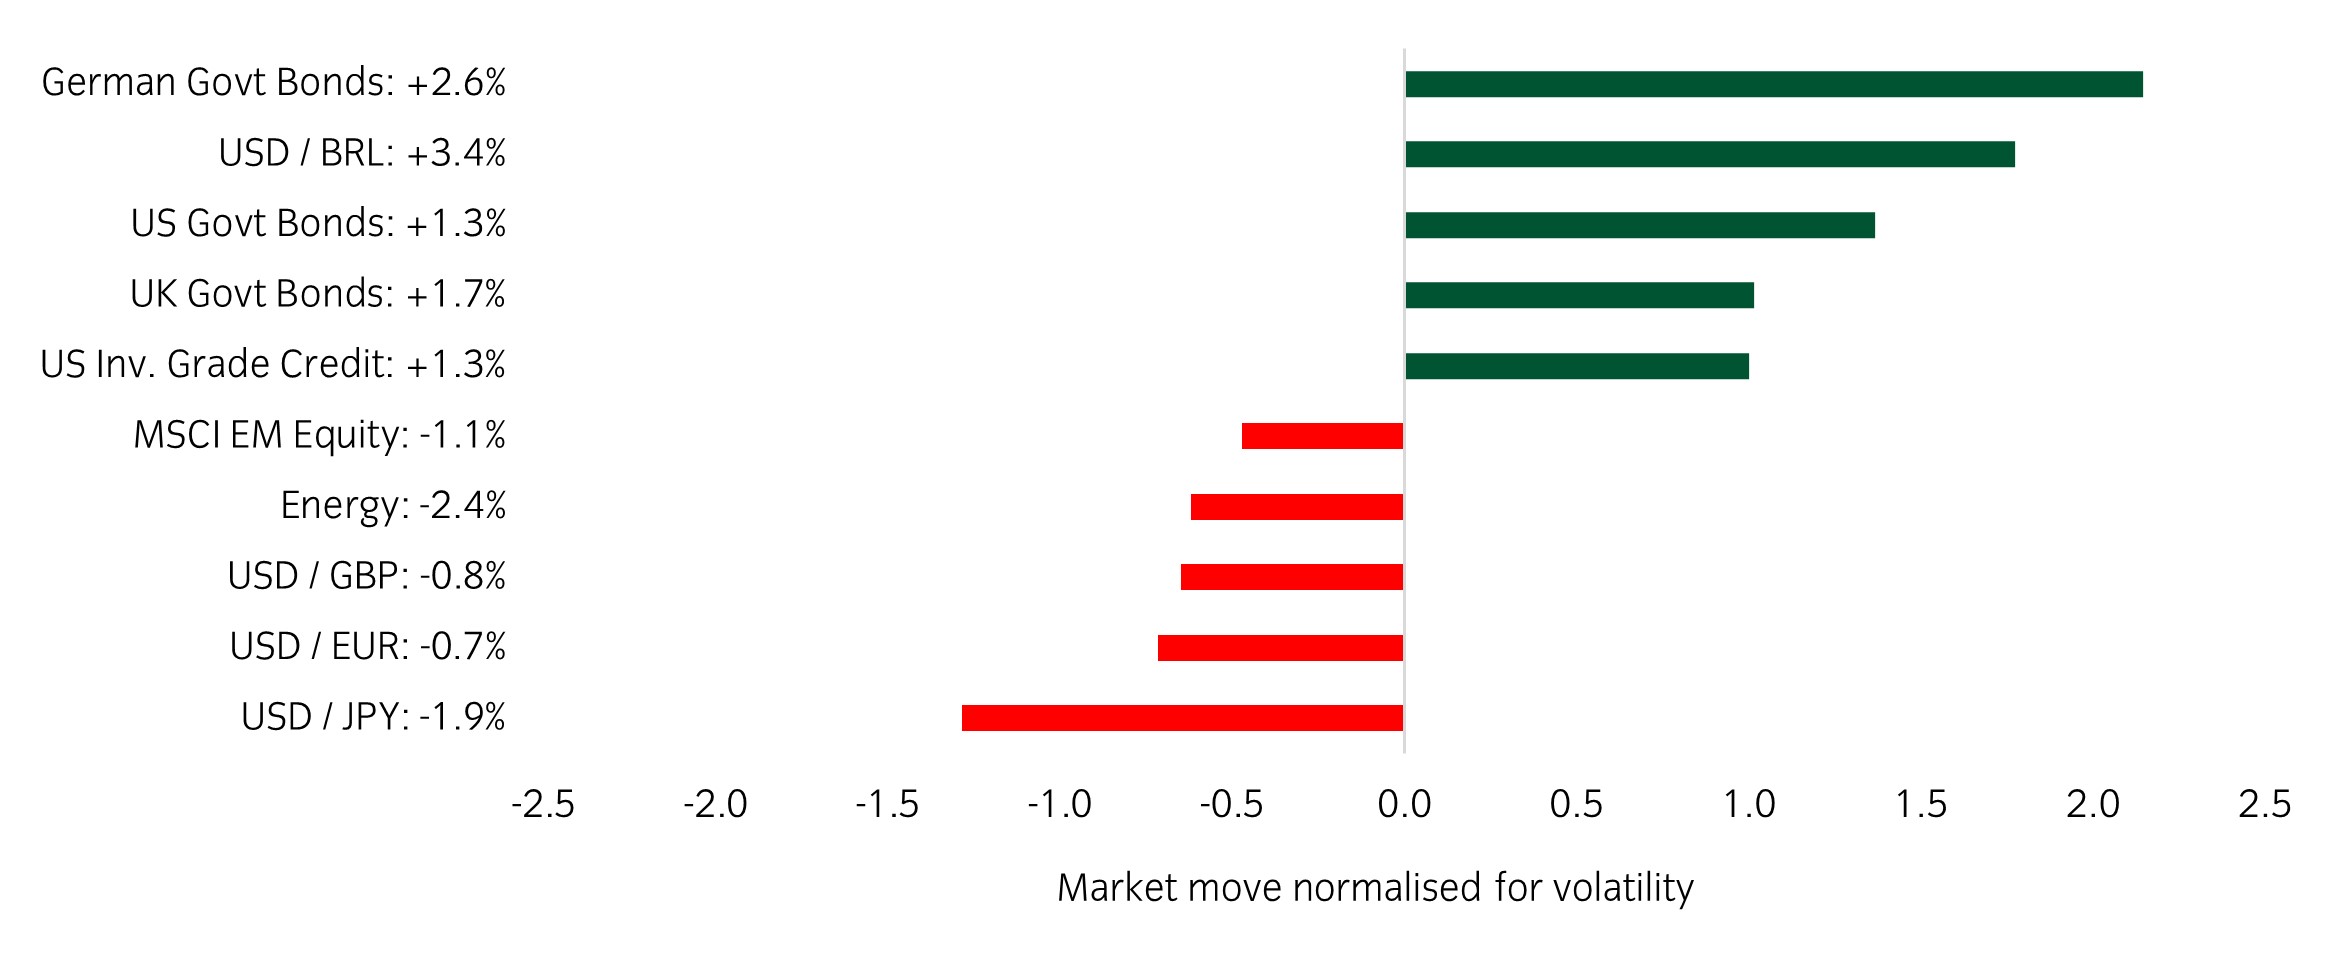
Significant market moves this week
Source: Bloomberg and Insight as at 29 November 2024. The price movement of each asset is shown next to its name. The data used by the bar chart divides the price movement by the annualised historical volatility of each asset.
Winners & losers: A relatively quiet week in terms of news flow, partially down to Thanksgiving on Thursday. Government bonds were the relative outperformers, while the US dollar gave back some recent gains against the Euro.
Over the past week, several things caught our eye:
- Scott Bessent was nominated as US Treasury Secretary late last Friday. He is considered a fairly conventional candidate compared to other potential candidates. Bond markets reacted constructively with the 10-year yield now 18bps lower since the announcement.
- The spread that French bonds trade above German bonds hit their widest levels since 2012 this week. This was driven by the difficulties of getting a belt-tightening budget through the French parliament. Negotiations are ongoing, but if agreement cannot be found the government could be brought down.
- Inflationary fears are growing in Japan following an upside Tokyo CPI print. The 2.6% headline number was comfortably above the 2.2% expected and the previous 1.8% figure. The initial market reaction was a stronger Yen, with USDJPY now hovering at 150.
Asset allocation observation
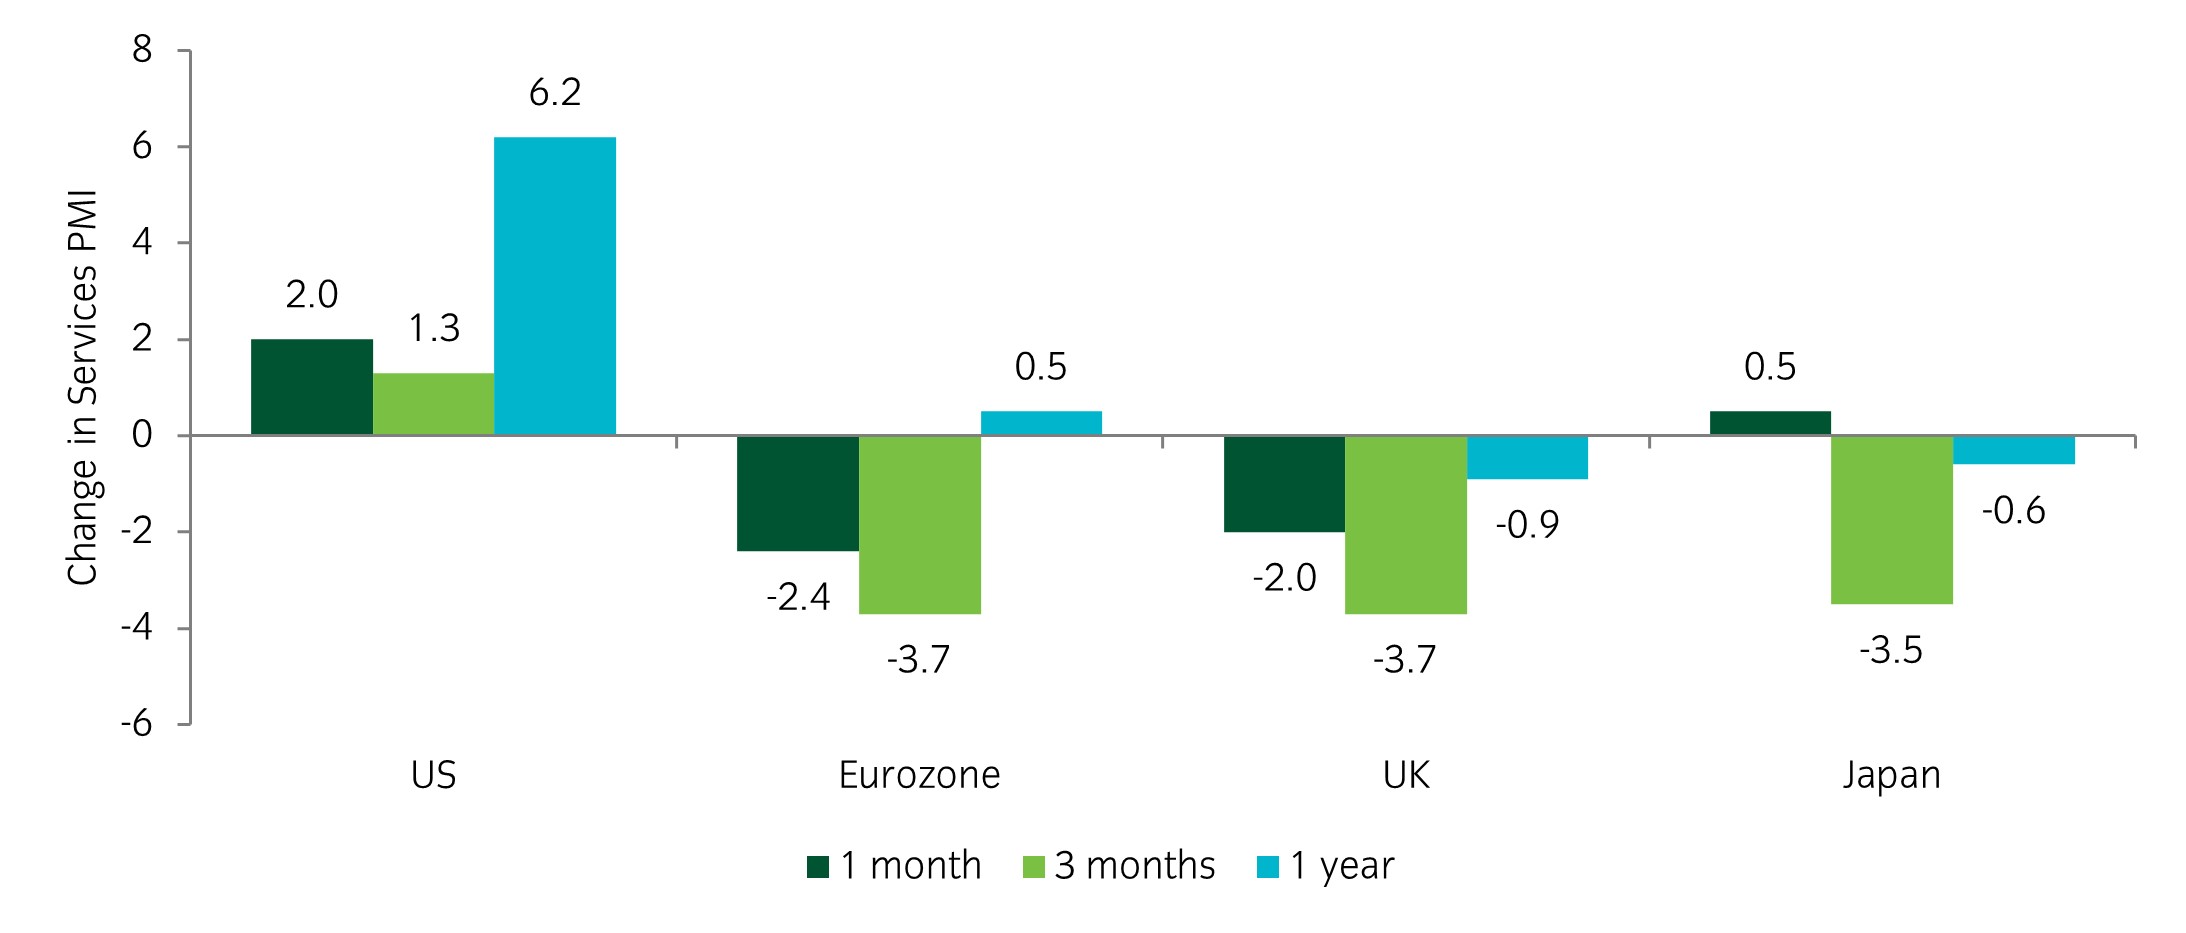
US service sector powers ahead
Source: Insight and Bloomberg as at 29 November 2024.
- While we tend to place greater emphasis on more cyclically sensitive manufacturing PMIs, the divergence of US services from other developed markets has become noticable. The relative economic strength of the US underpins our overweight US vs Europe equity position, alongside our duration composition that favours German bunds over US Treasuries.
Chart of the week
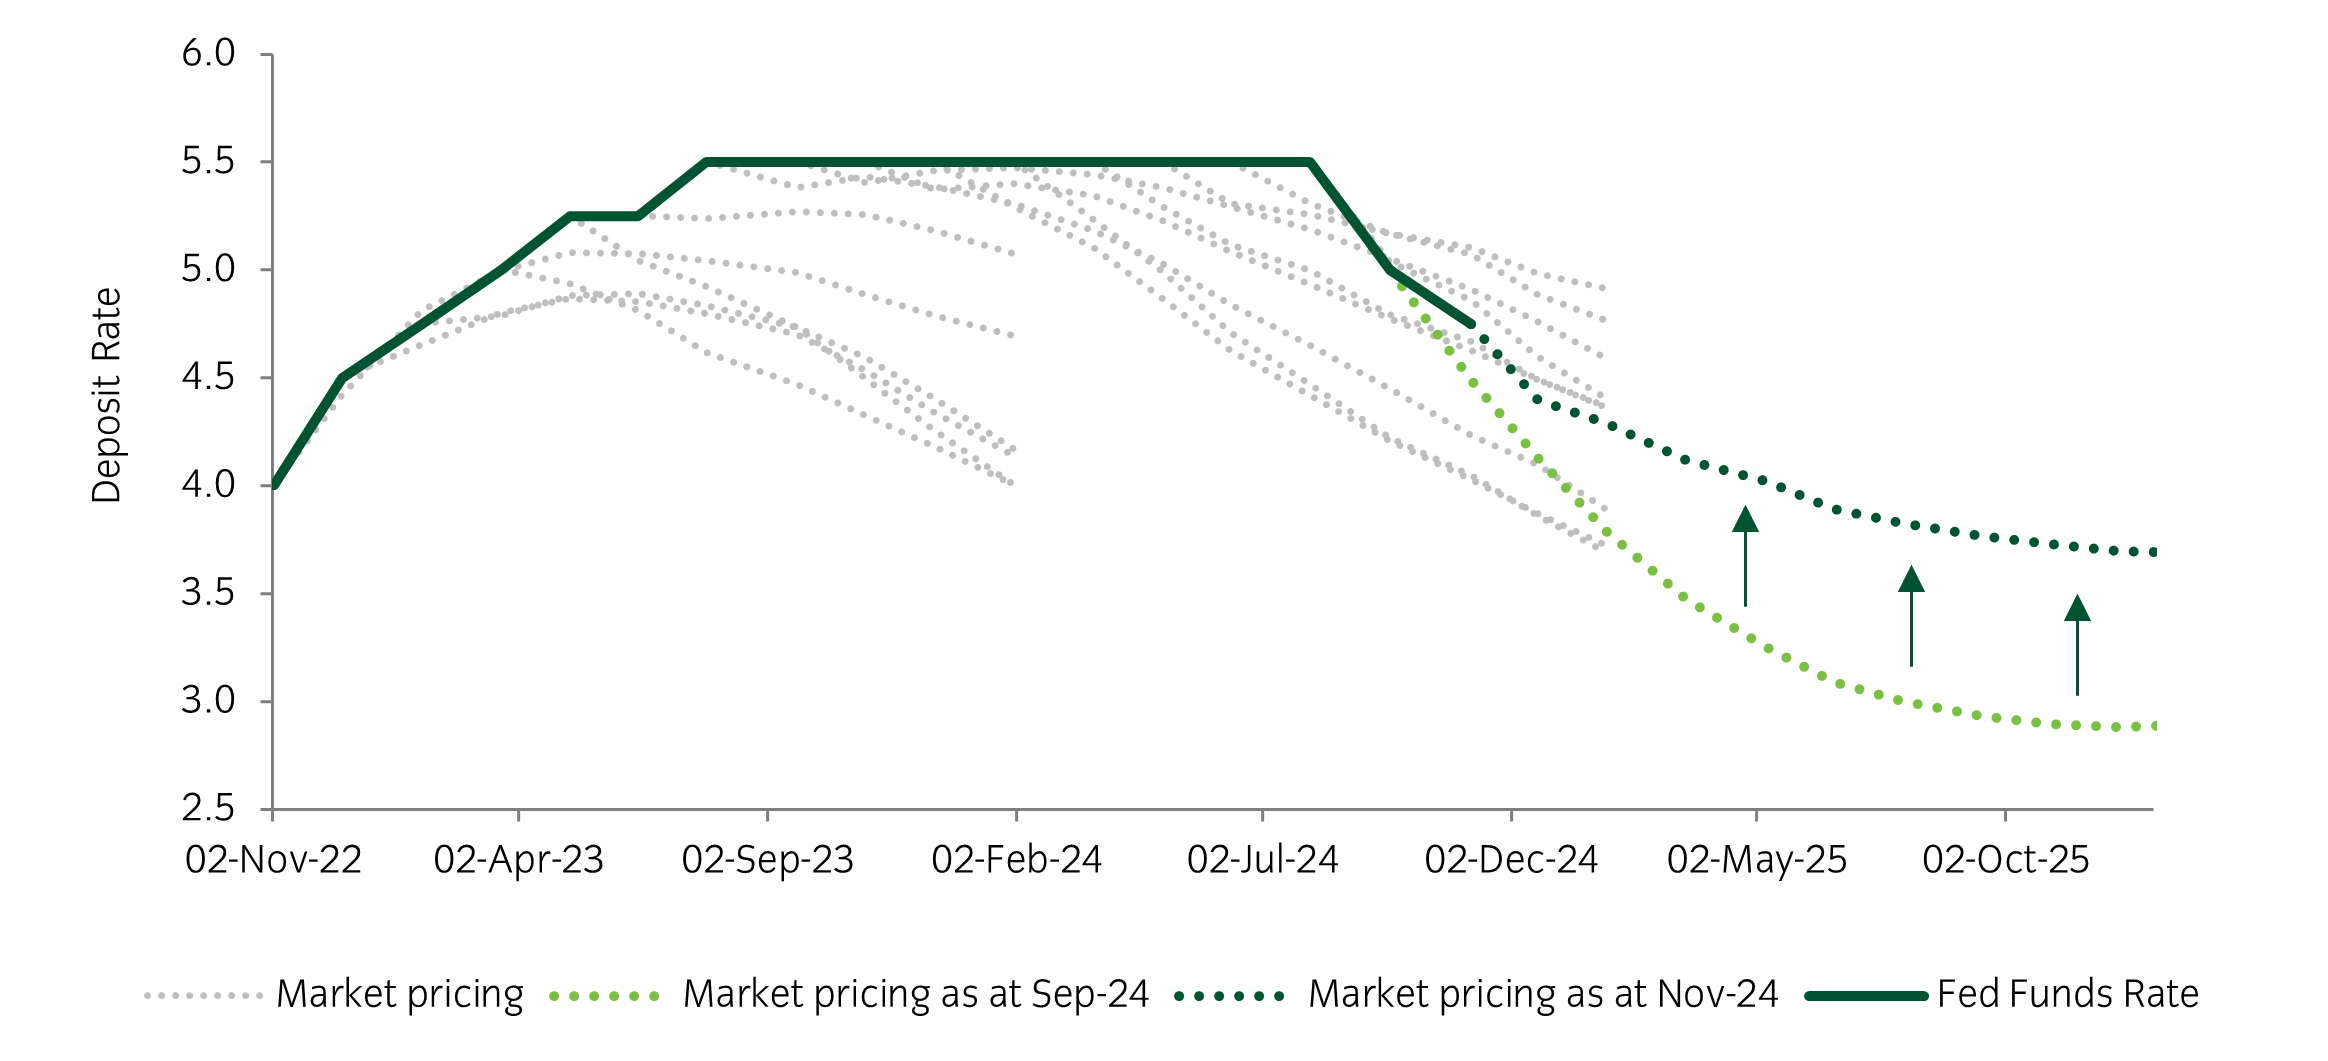
Number of expected rate cuts has reduced since the US election
Source: Insight Investment and Bloomberg as at 22 November 2024.
- The Federal Reserve was on pause from June 2023 until September 2024. For much of this period, the market expected the Fed to deliver rate cuts more quickly than it eventually did. At the time of the Fed’s first cut, concerns around growth had become elevated and caused the market to price in a fed funds rate of 3% by the end of 2025. Since then, resilient growth data and Donald Trump’s election have led the expected rate by end-2025 to move to 3.7%.
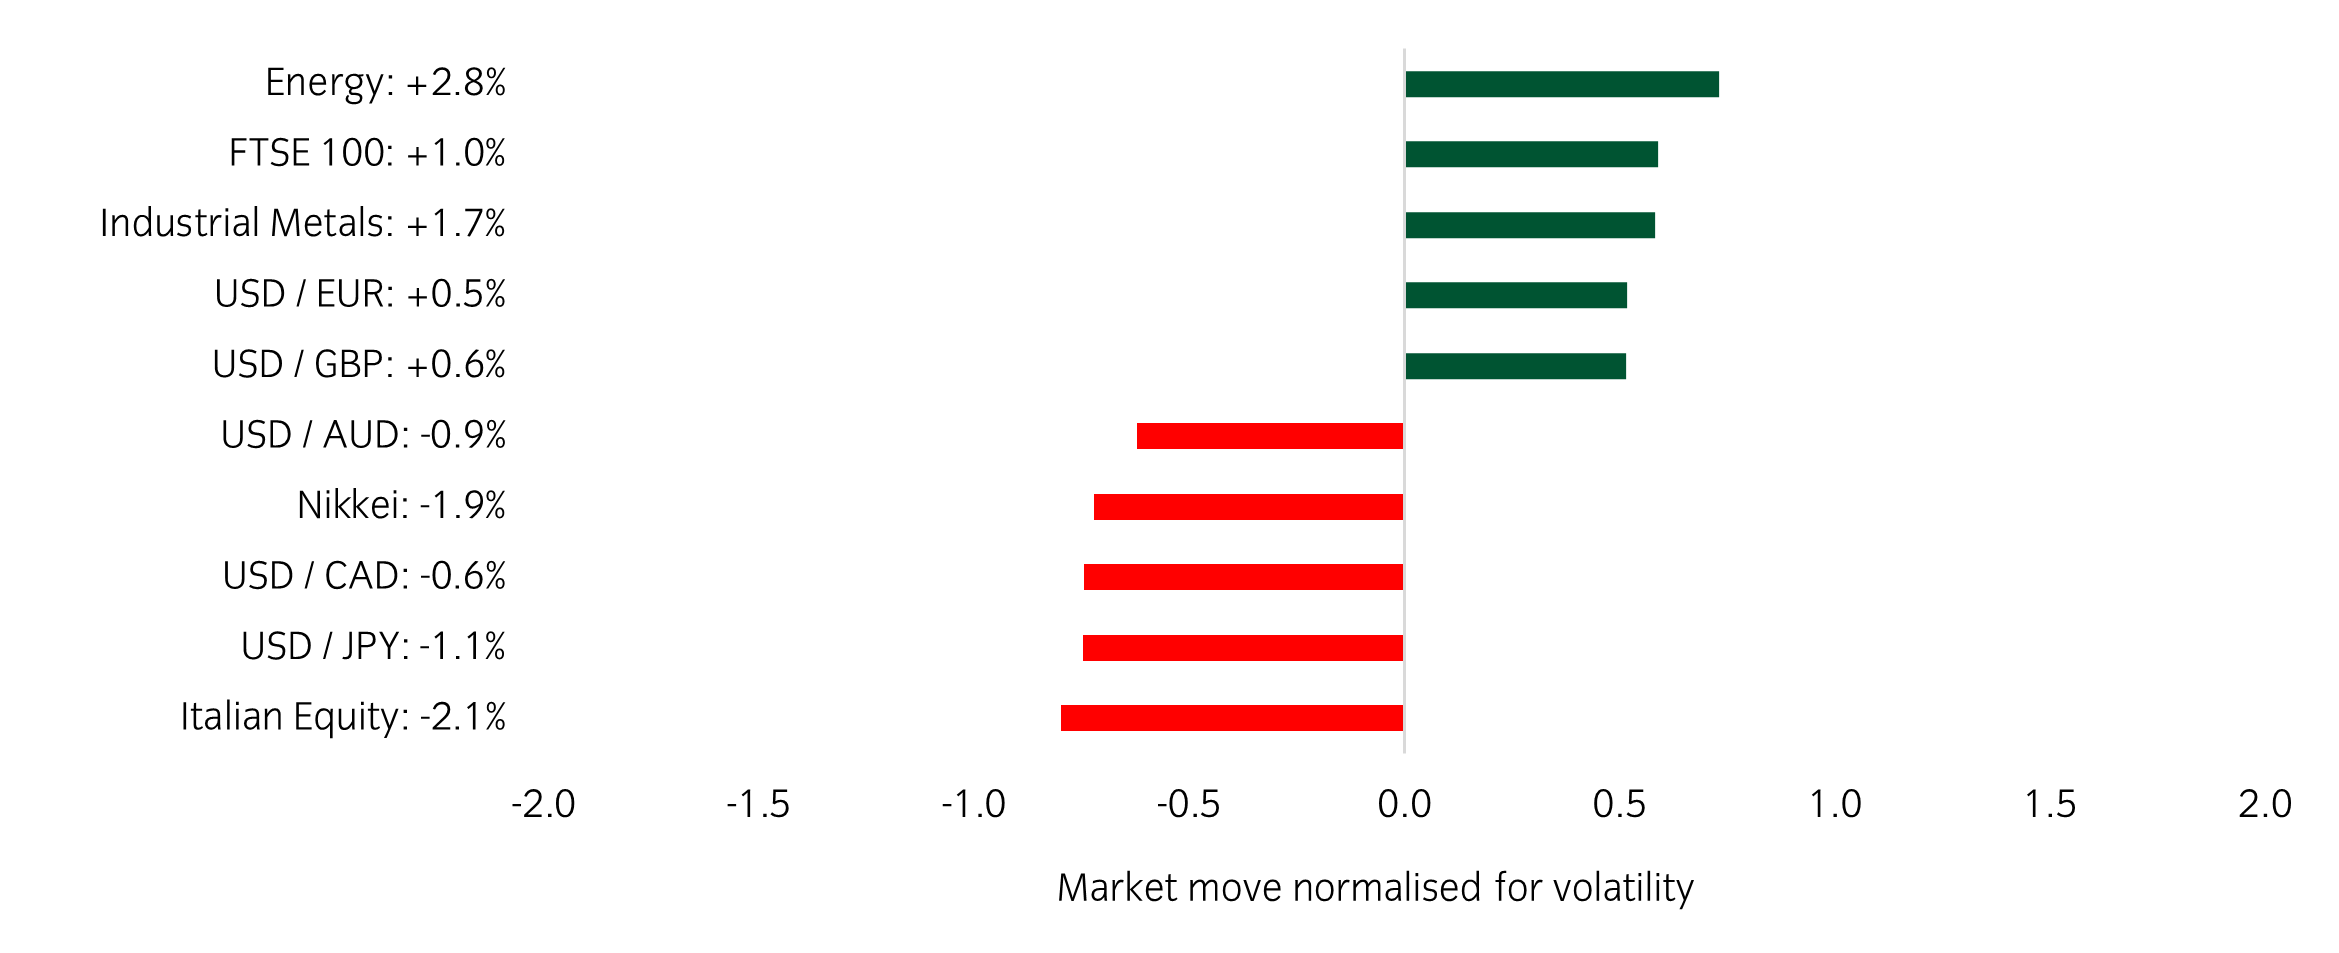
Significant market moves this week
Source: Bloomberg and Insight as at 22 November 2024. The price movement of each asset is shown next to its name. The data used by the bar chart divides the price movement by the annualised historical volatility of each asset.
Winners & losers: There were only small week-on-week moves. The energy and industrial sectors outperformed alongside USD / EUR.
Over the past week, several things caught our eye:
- The Ukraine / Russia conflict saw further escalation, with Ukraine launching US & UK missiles into Russian territory, while Putin signed a revision to Russia’s nuclear doctrine. Increased geopolitical risk meant oil and gold prices increased during the week.
- Nvidia released its much-anticipated 3rd quarter earnings, beating revenue expectations ($35bn vs $33.25bn exp.) and raising guidance. The after-hours reaction was negative, with fast money expecting a larger rise to forward guidance. However, by the closing bell the stock had reversed losses and closed +0.5% higher.
- Flash PMIs for November have shown a mixed set of data so far. Most notable was the underperformance of European, and in particular French, services. French services dropped to 45.7, versus 49.2 last month and 49 expected. The data boosts the narrative of underperforming growth in Europe relative to the US.
Asset allocation observation
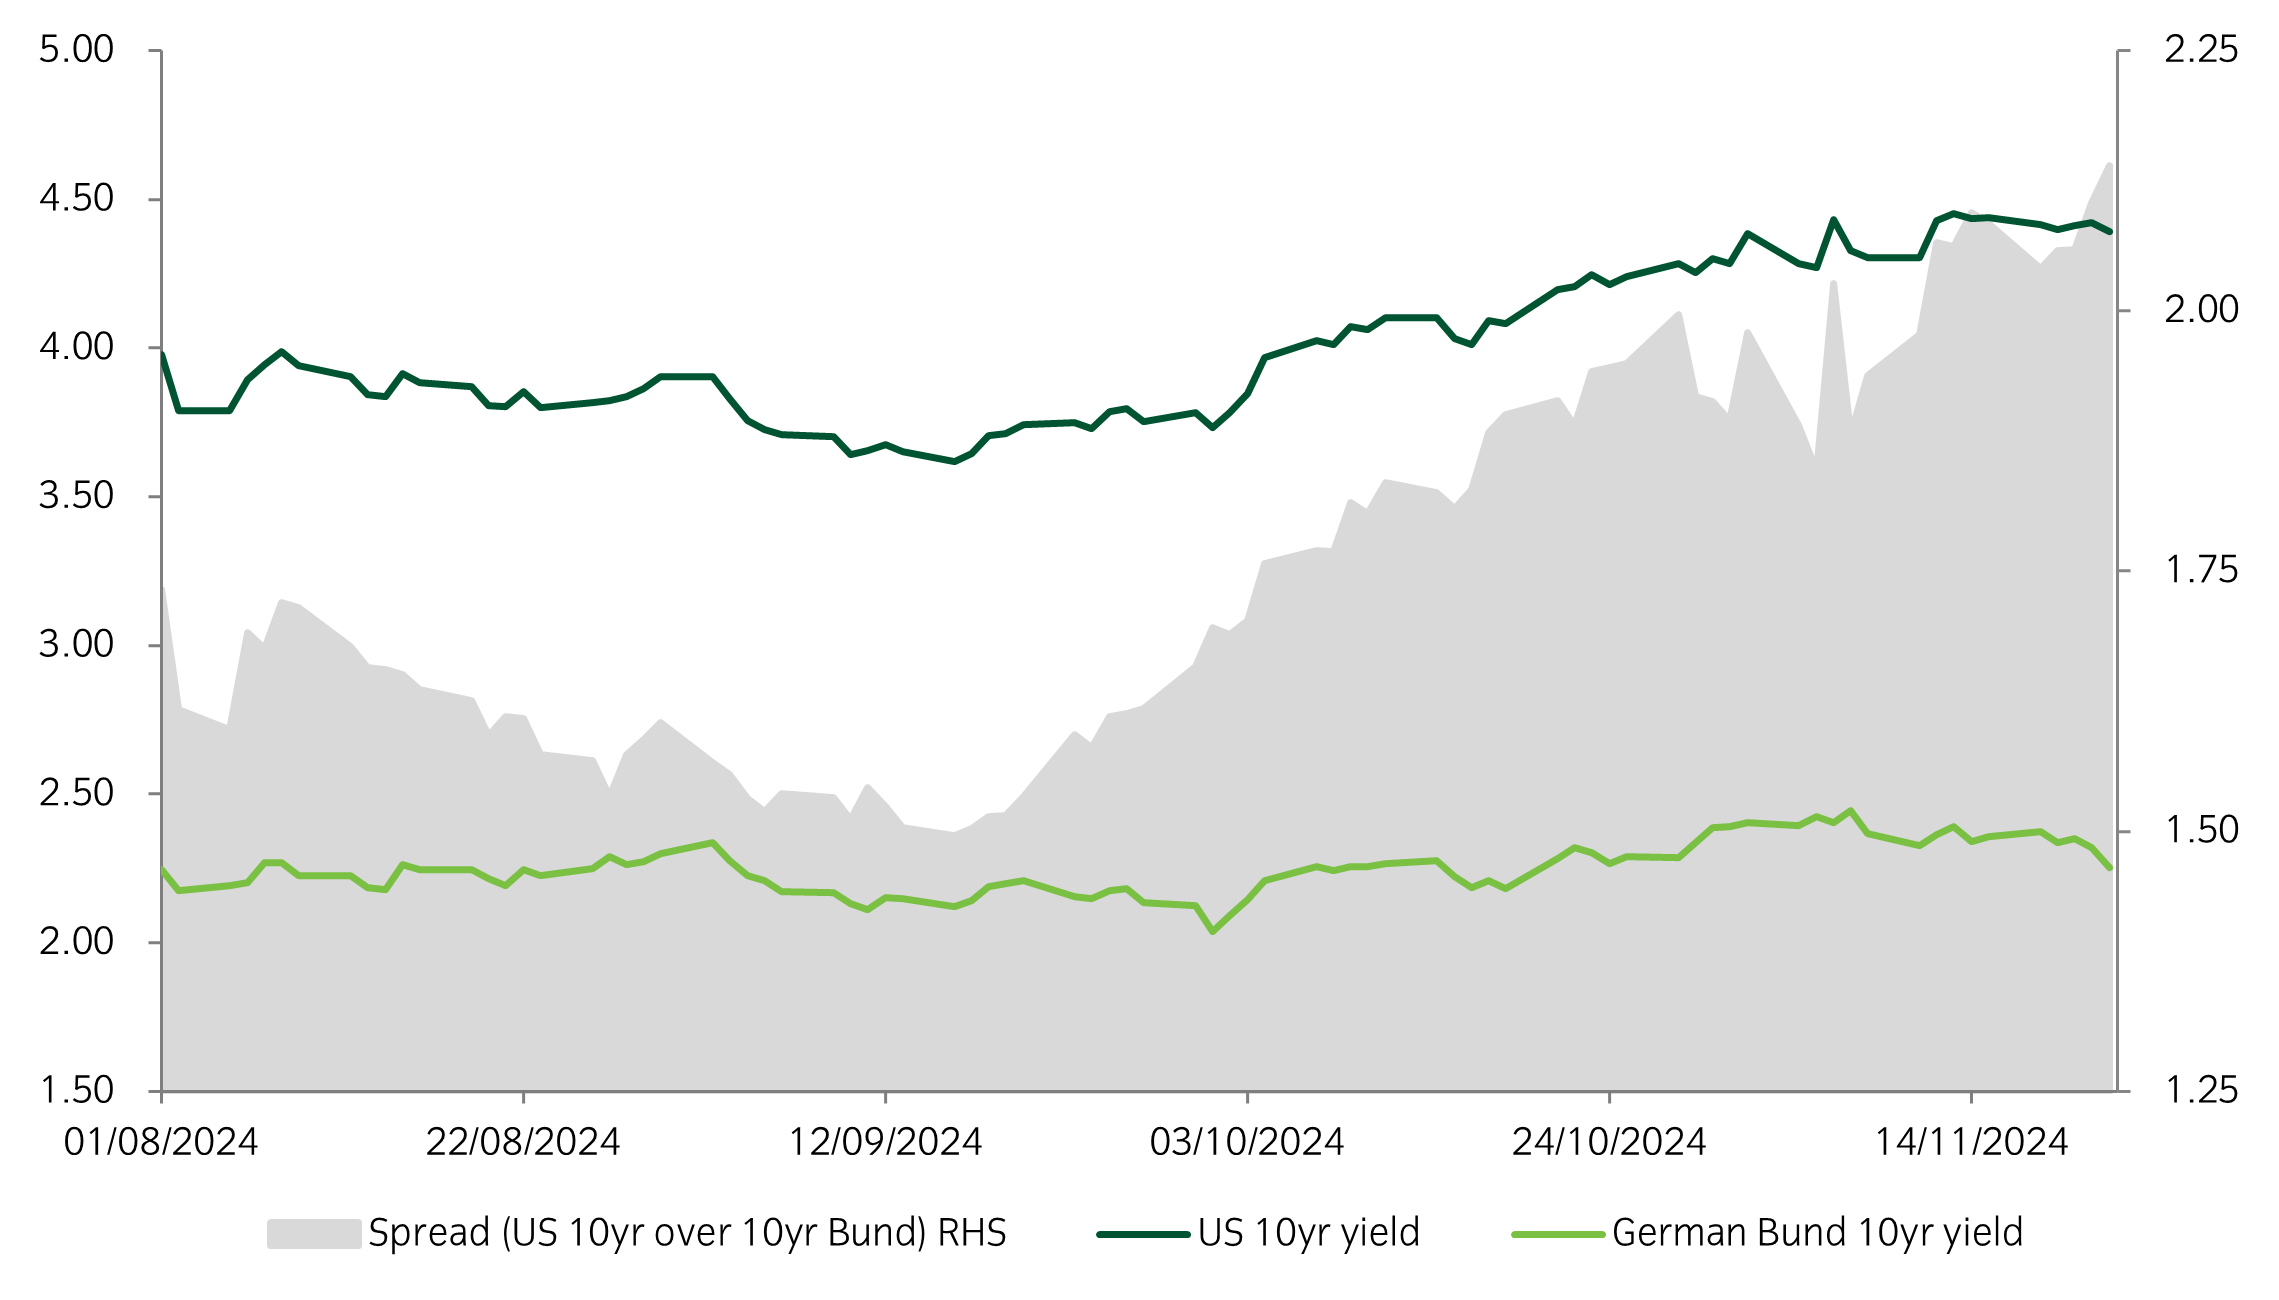
US / European spreads widening
Source: Insight and Bloomberg as at 15 November 2024.
- The diverging growth picture between the US and Europe has seen the spread between their respective government bonds widen steadily since mid-September. This has been given further impetus since Trump’s election victory, with his policies seen as more growth positive and somewhat inflationary.
- This aligns with our portfolio positioning as our duration composition favours German bunds over US Treasuries.
Chart of the week
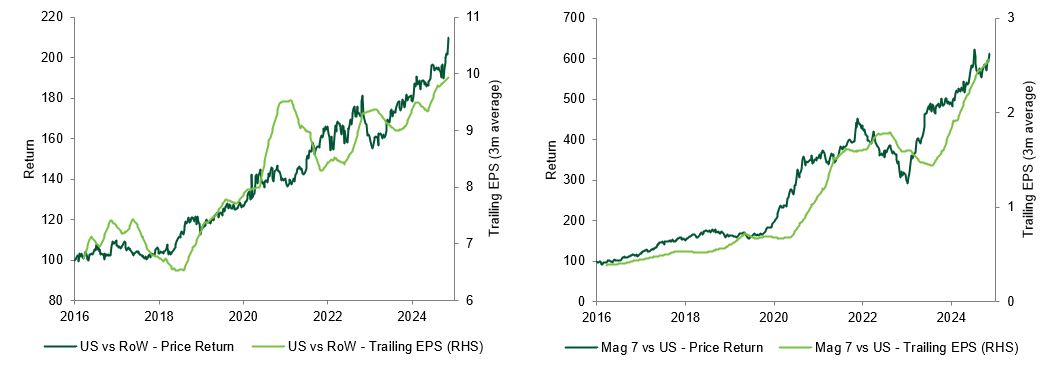
US exceptionalism driven by ‘Magnificent 7’ megacap earnings
Source: Insight Investment and Bloomberg as at 15 November 2024.
- The United States is on track for one of its best performing years since the turn of the century relative to the rest of the world. Over the past 15 years, it has outperformed in 13, driven by robust earnings growth that has consistently outpaced global counterparts. This impressive performance is largely attributed to the 'Magnificent 7' – Apple, Amazon, Google, Meta, Microsoft, Nvidia, and Tesla – whose price performance and earnings growth have been exceptional.
- Looking ahead to 2025, there is potential for another strong year in asset returns. However, a key concern remains: how much further can US equity markets rally from their already lofty valuations? This question is particularly significant given the dominant position of the US in global equity indices.
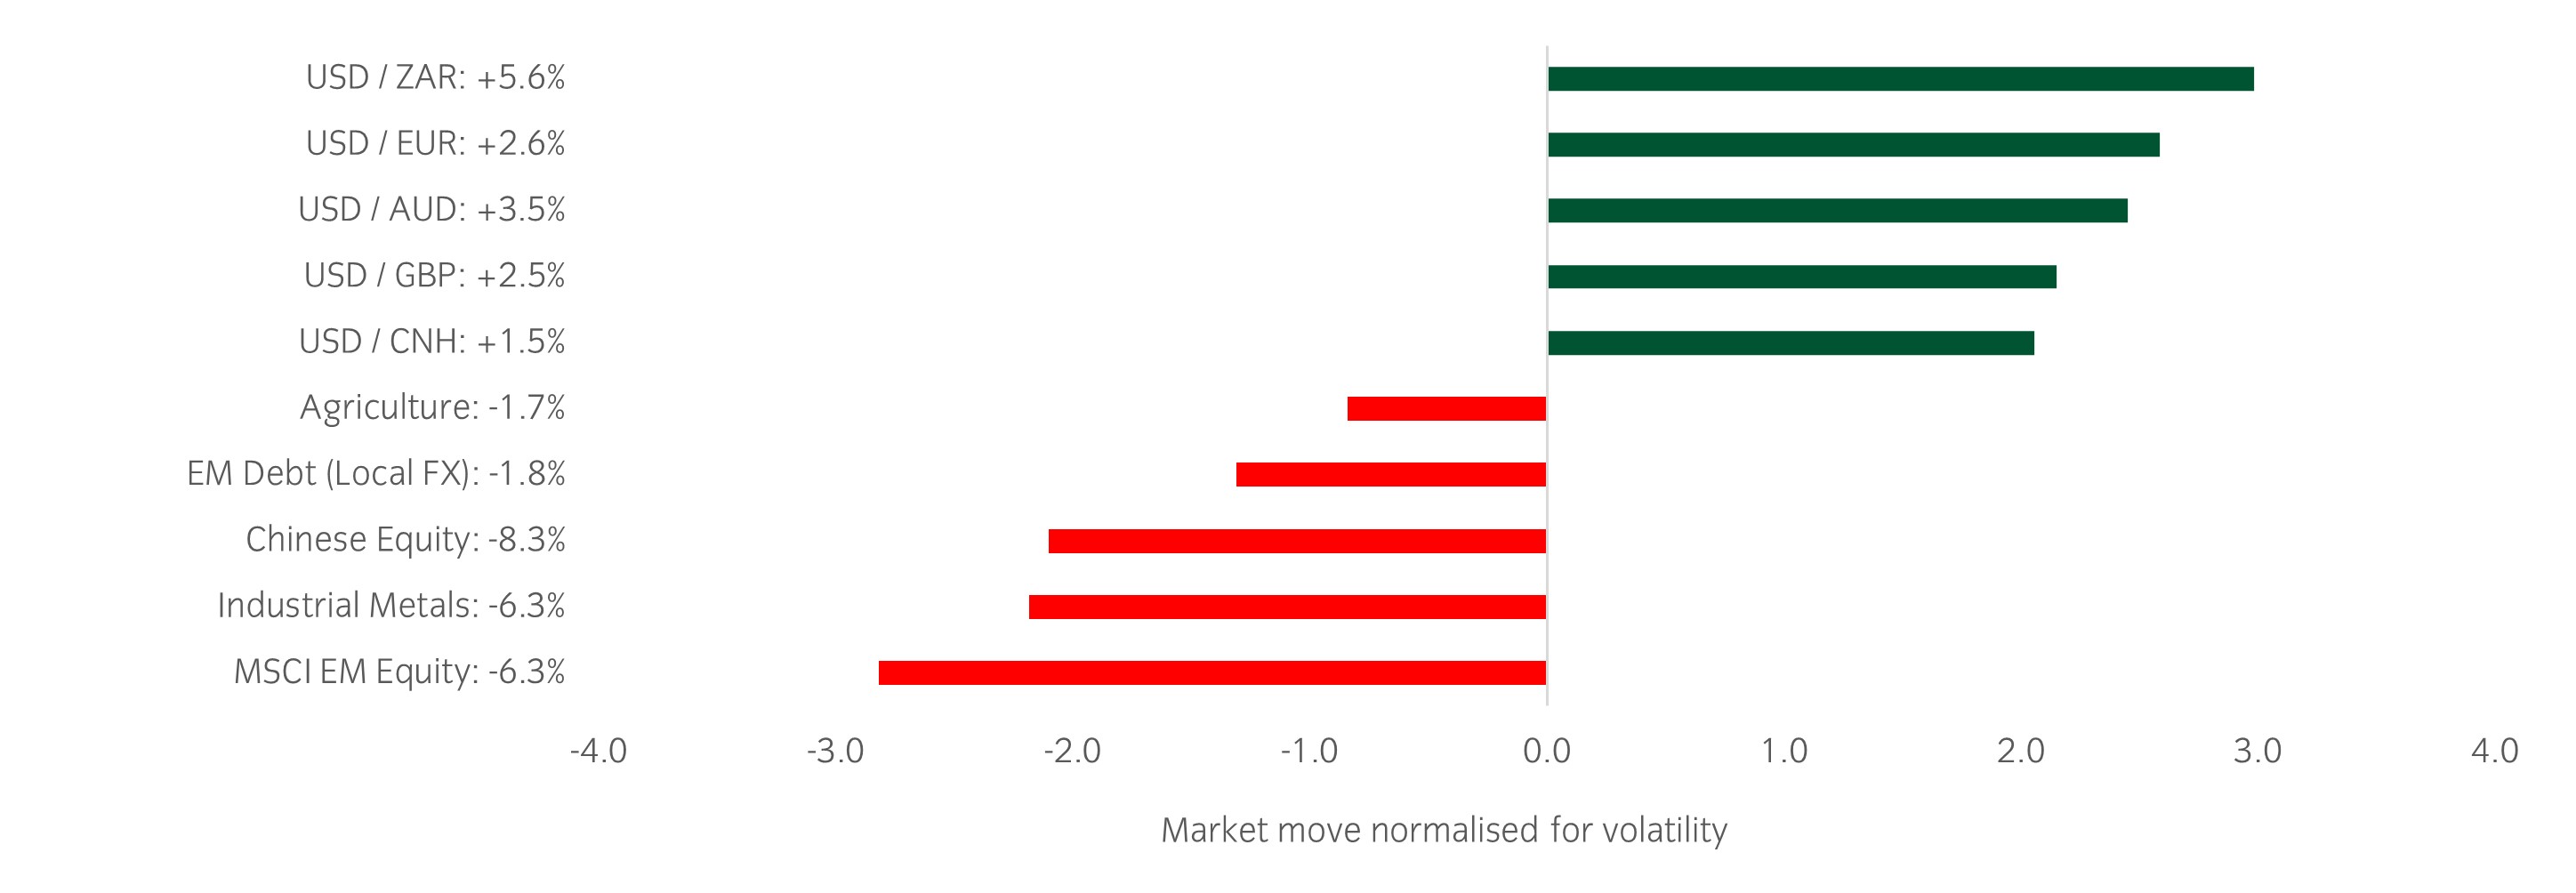
Significant market moves this week
Source: Bloomberg and Insight as at 15 November 2024. The price movement of each asset is shown next to its name. The data used by the bar chart divides the price movement by the annualised historical volatility of each asset.
Winners & losers: The dollar marched higher this week while the Asian equity complex was the largest underperformer.
Over the past week, several things caught our eye:
- As the dust settled from what was the most important week of the year, trends have begun to solidify, with US equity a relative winner against both Europe and Asia. Against a backdrop of perceived higher for longer rates, the US Dollar has broken out of a two-year range, while the likelihood of a Fed rate cut in December has dropped to 62%.
- The main data point this week was US CPI, which came largely in line with estimates, amid concerns that there would be an upside surprise. The 28bp month-on-month increase means the year-on-year number ticked up to 2.6% (from 2.4% previously).
Very little news on the micro front although a few headlines from the semiconductor space. Firstly, the US imposed export restrictions on certain TSMC (-7%) chips to China, while ASML (+7%) reaffirmed its bullish outlook through 2030 with chip demand driven by AI.
Asset allocation observation
Services inflation remains elevated
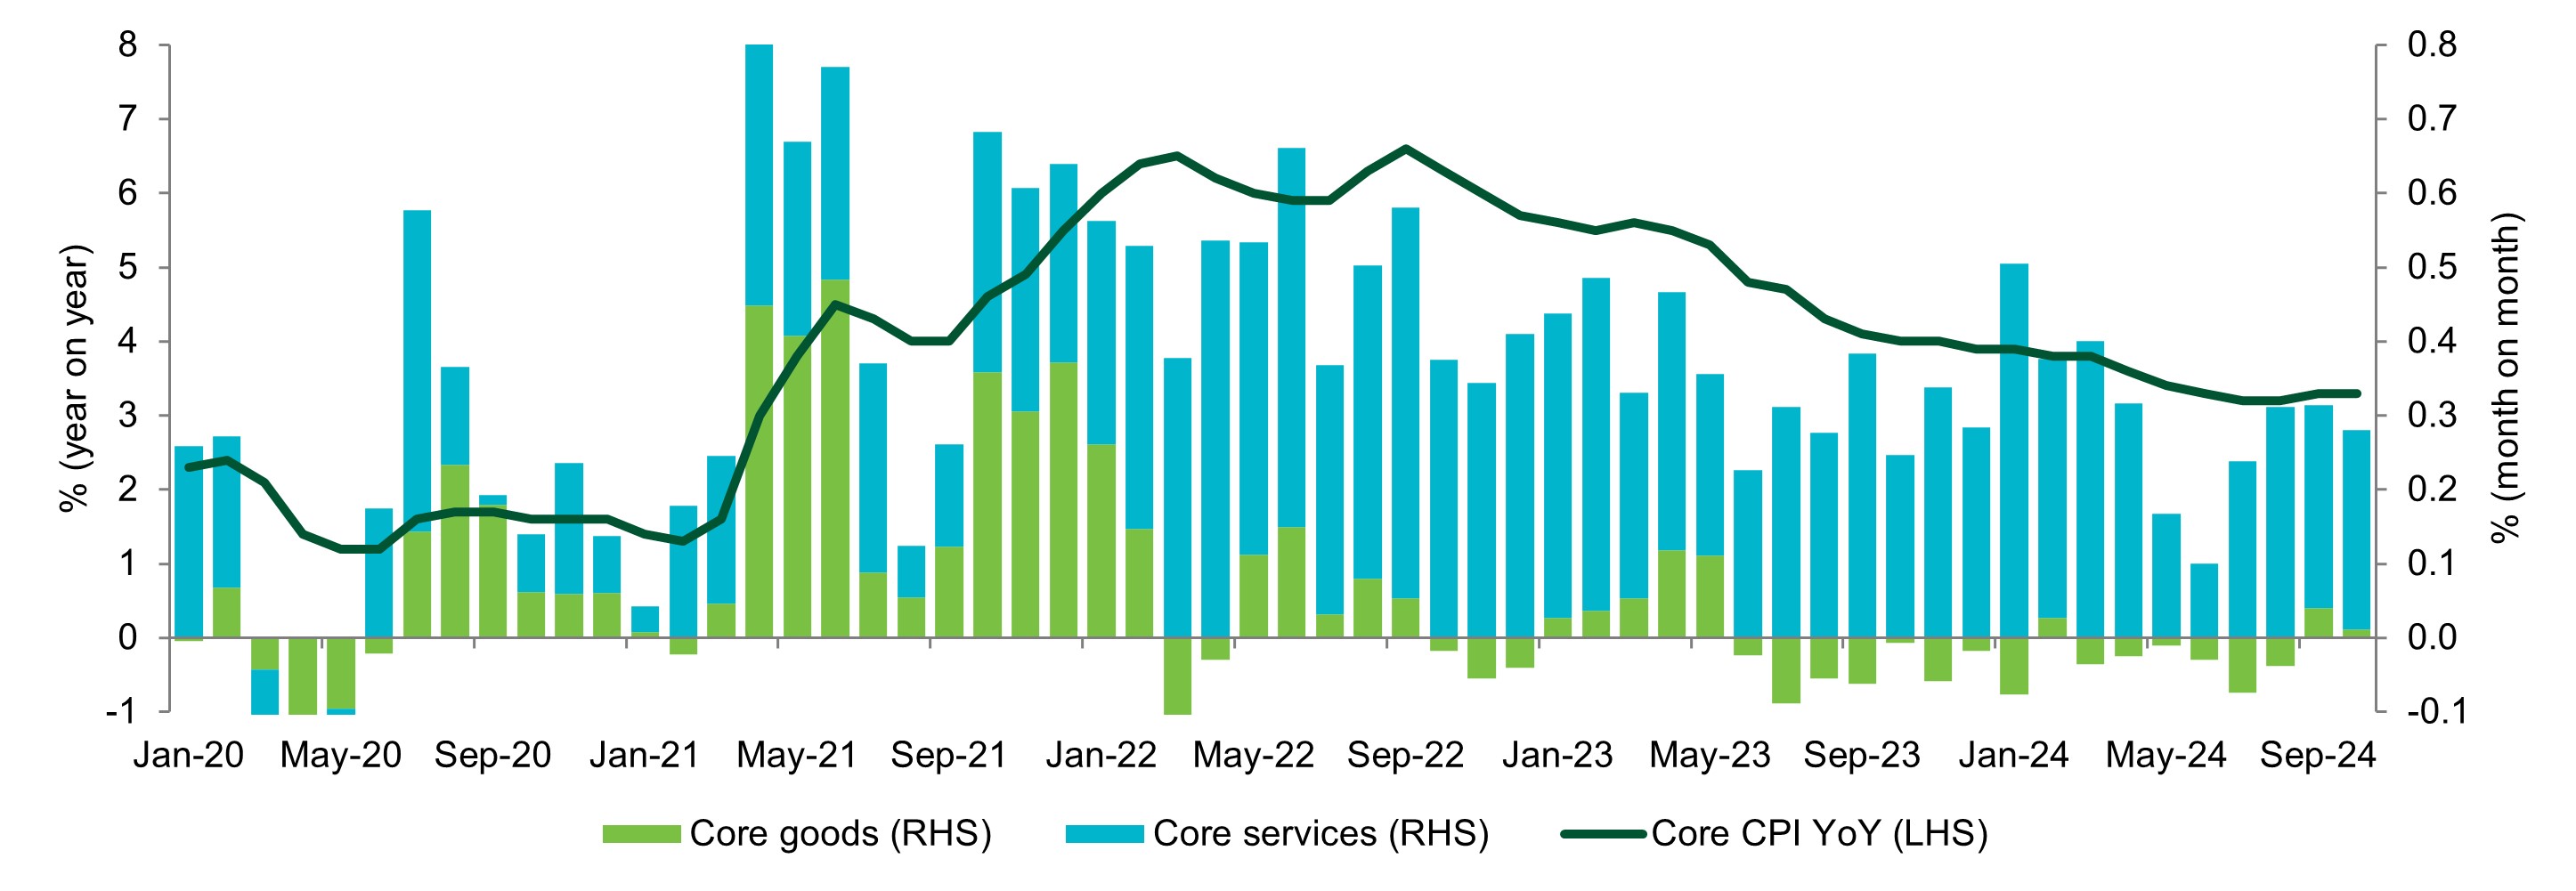
Source: Insight and Bloomberg as at 15 November 2024.
- While the trend in inflation remains lower, this is largely due to a deflationary impluse from goods while less progress has been made on services. Jerome Powell this week pointed to a robust economy as a reason to not descend too quickly, and signs that stickier inflation is persisting should add to that narrative.
Chart of the week
Financials were the top performing US sector after Trump’s Victory
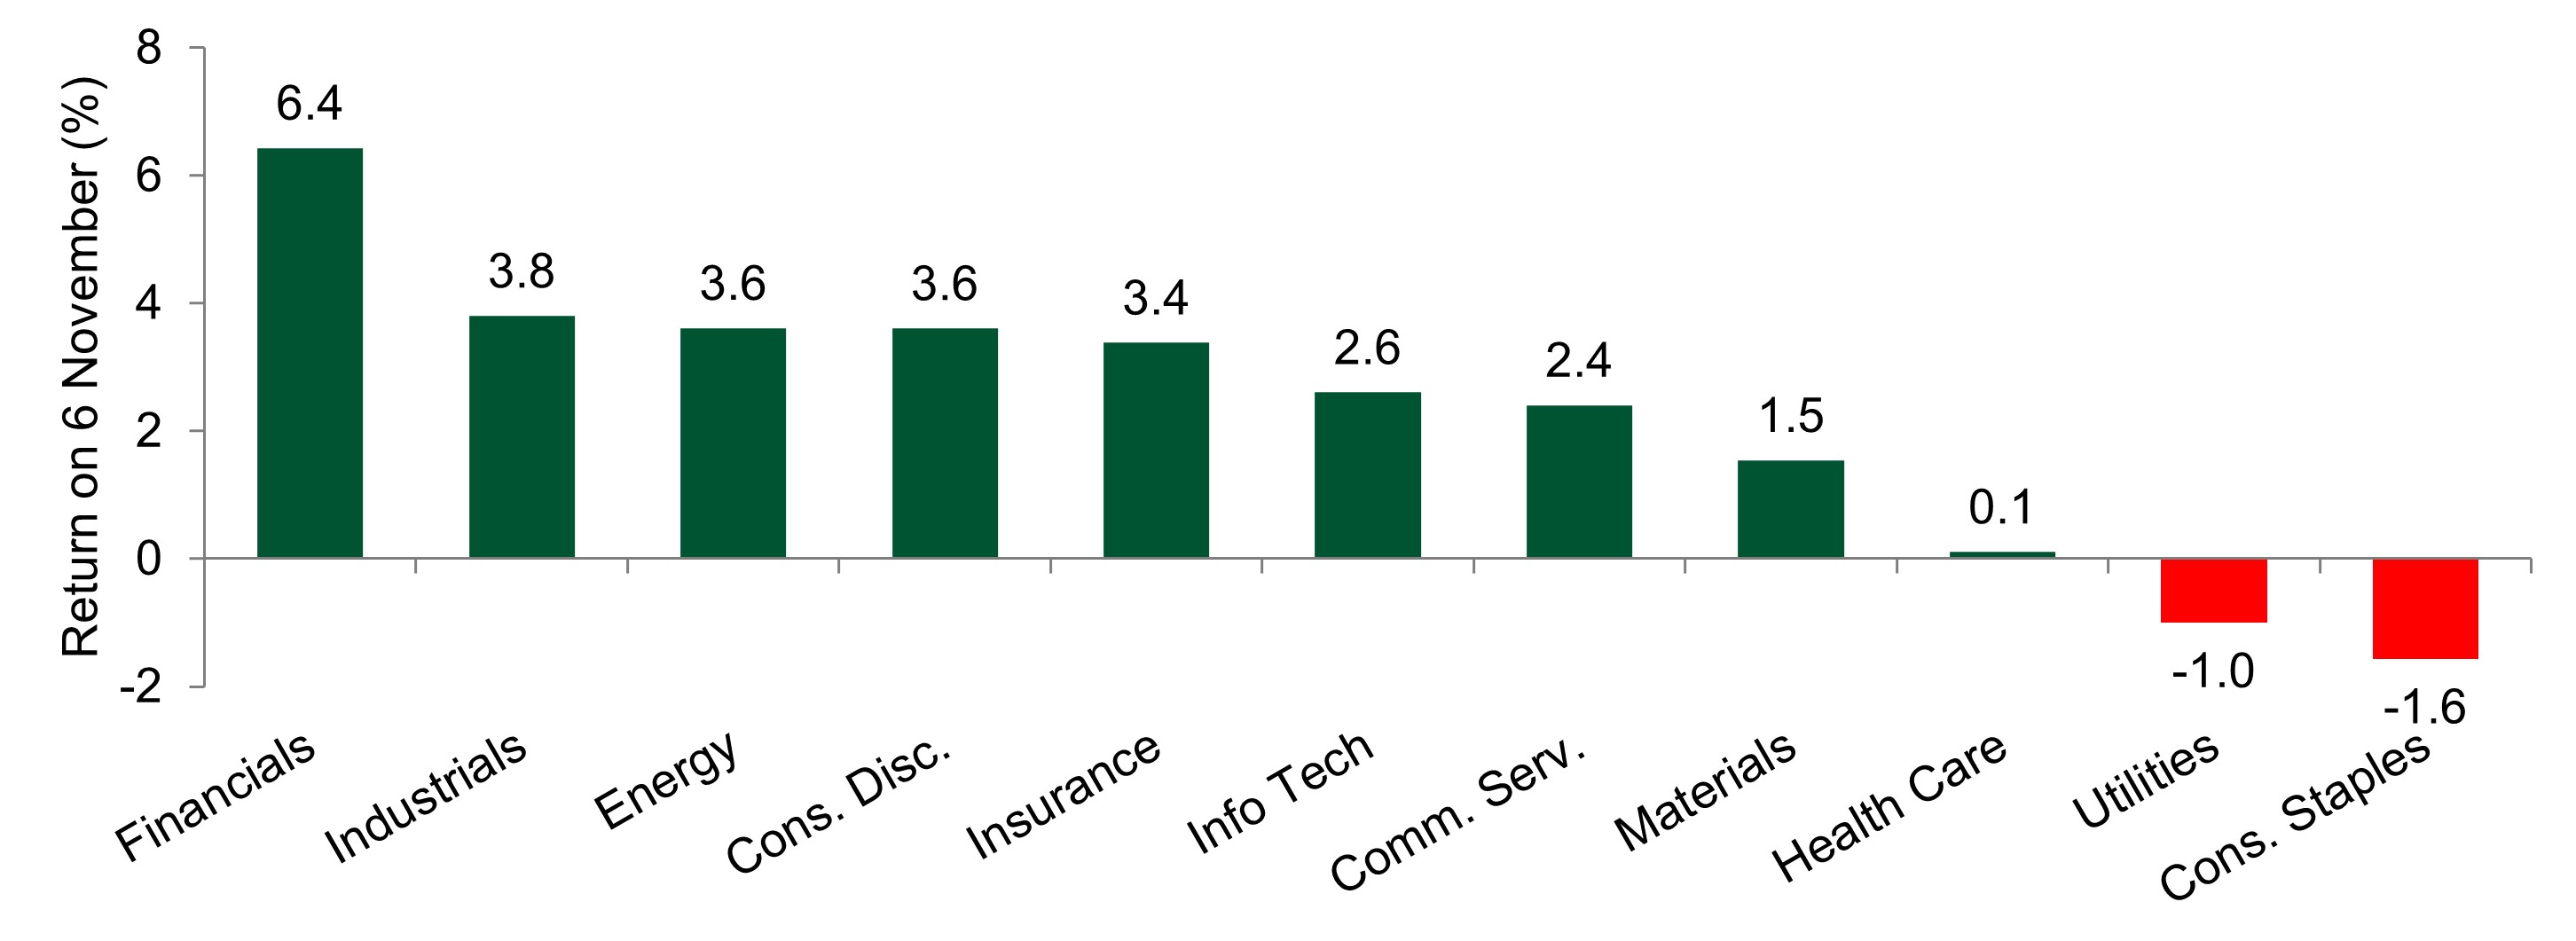
Source: Insight Investment and Bloomberg as at 8 November 2024.
- Financials were the top performing US sector following Donald Trump’s victory in the US election this week. This was mainly driven by the banks (+11.7%) which are expected to benefit from potential deregulation and a stronger growth backdrop. The relative losers were those areas of the markets more sensitive to interest rates, such as utilities and consumer staples, who struggled in the face of a 16 basis point rise in 10-year US Treasury yields.
Significant market moves this week
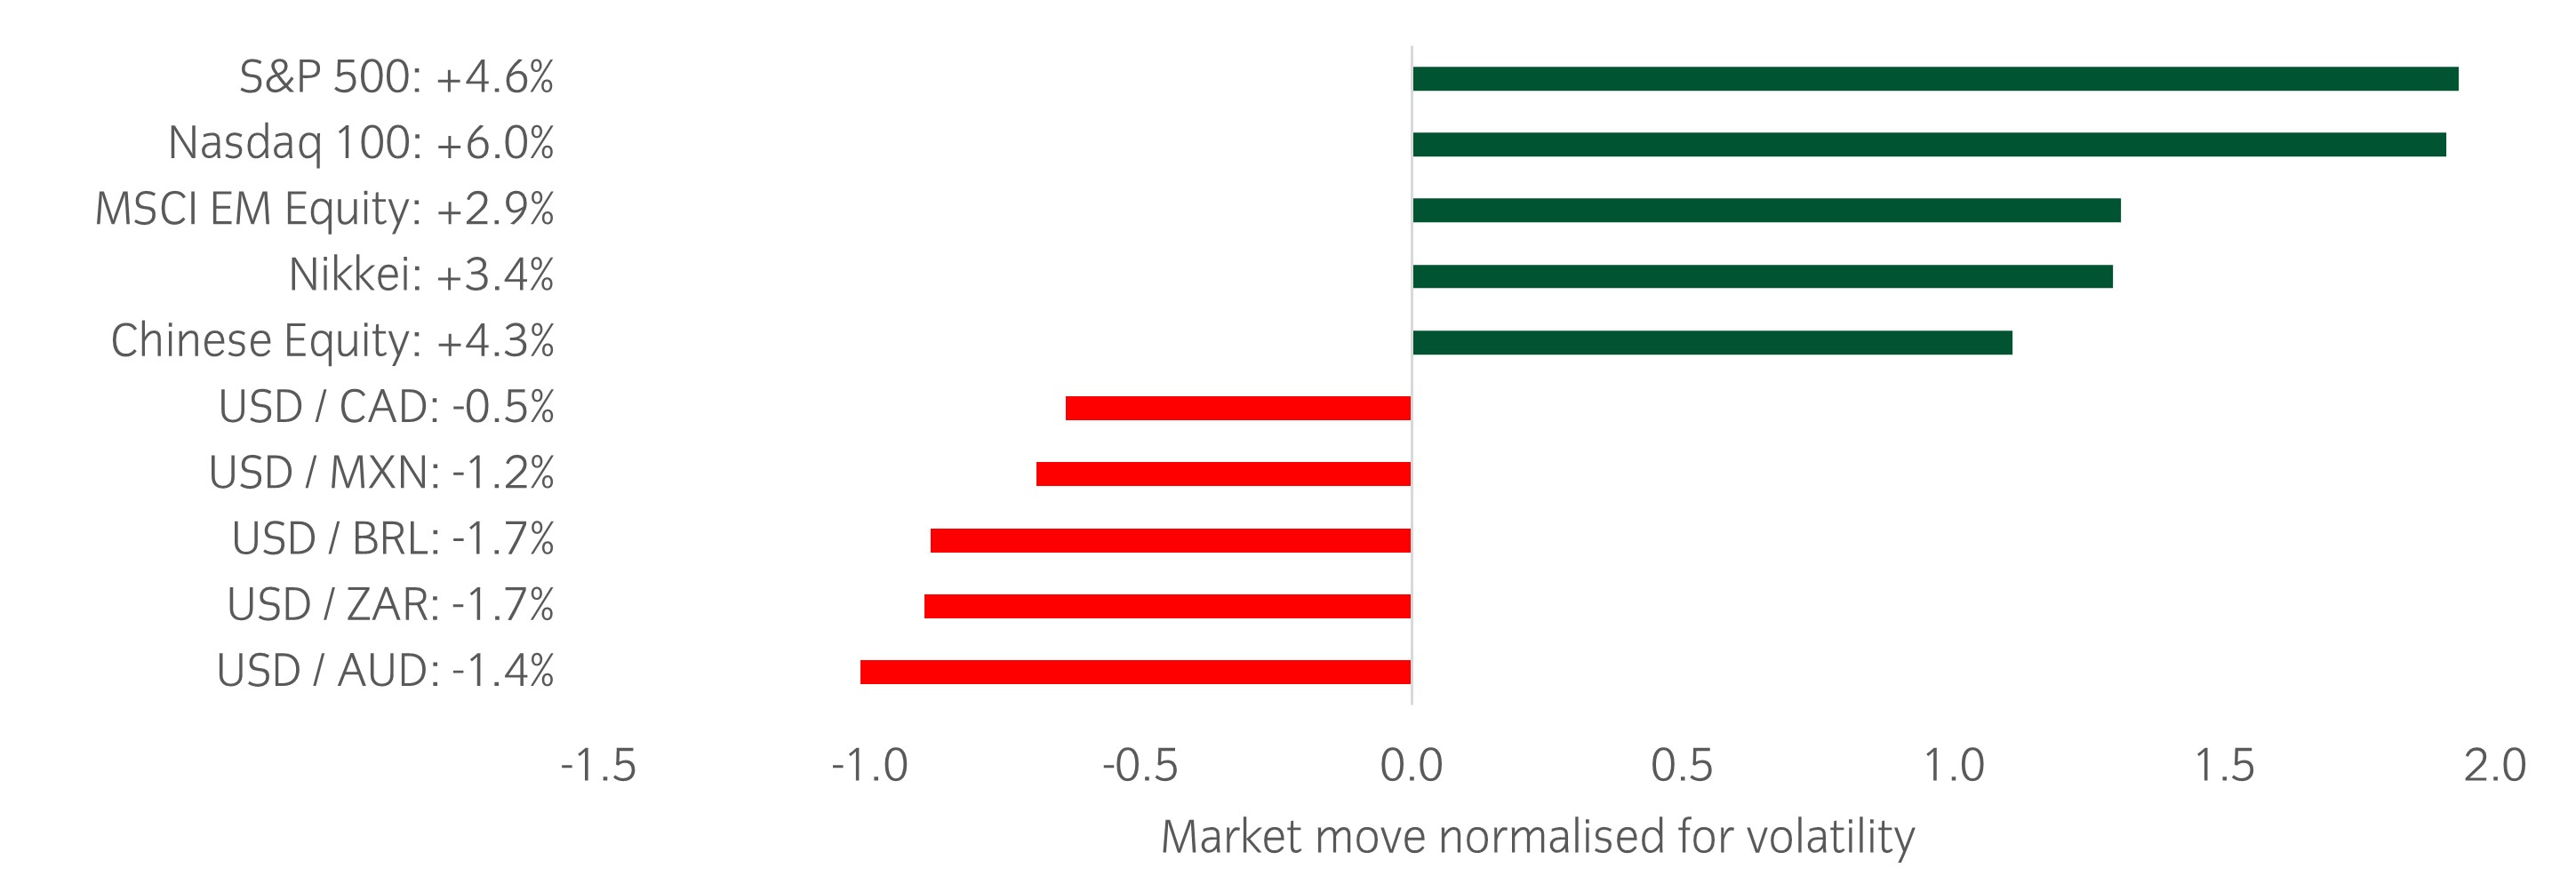
Source: Bloomberg and Insight as at 8 November 2024. The price movement of each asset is shown next to its name. The data used by the bar chart divides the price movement by the annualised historical volatility of each asset.
Winners & losers: US equities posted strong returns on the week alongside the Nikkei, which gained off the back of a weaker yen. The dollar weakened against cyclical currencies such as the Australian Dollar and South African Rand.
Over the past week, several things caught our eye:
- A busy week was dominated by the US election, in which Donald Trump secured the presidency and the Republican Party looks to have secured control of the House and Senate. Initial market moves were positive for US equities and the US dollar, while Treasury yields jumped higher as Trump’s policy agenda looks to be more inflationary than that of Harris.
- Major central banks continued to cut rates with both the Federal Reserve and Bank of England cutting interest rates by 25bp, as widely expected. Fed Chair Jerome Powell decided to avoid discussing the potential impact of the US election, saying “We don’t know what the timing and substance of any policy changes will be”. It has been reported that Trump will allow Powell to serve out his term as Fed Chair which is due to end in May 2026.
- The main economic data released this week was the US ISM Services Index and it was much stronger than expected. October’s level of 56 comfortably exceeded the consensus of 53.8 and is the strongest number in over 2 years. Manufacturing remains in a slump but improving forward indicators, alongside strong services data, are enough to allay growth concerns.
Asset allocation observation
Central banks are in easing mode (ex Japan)
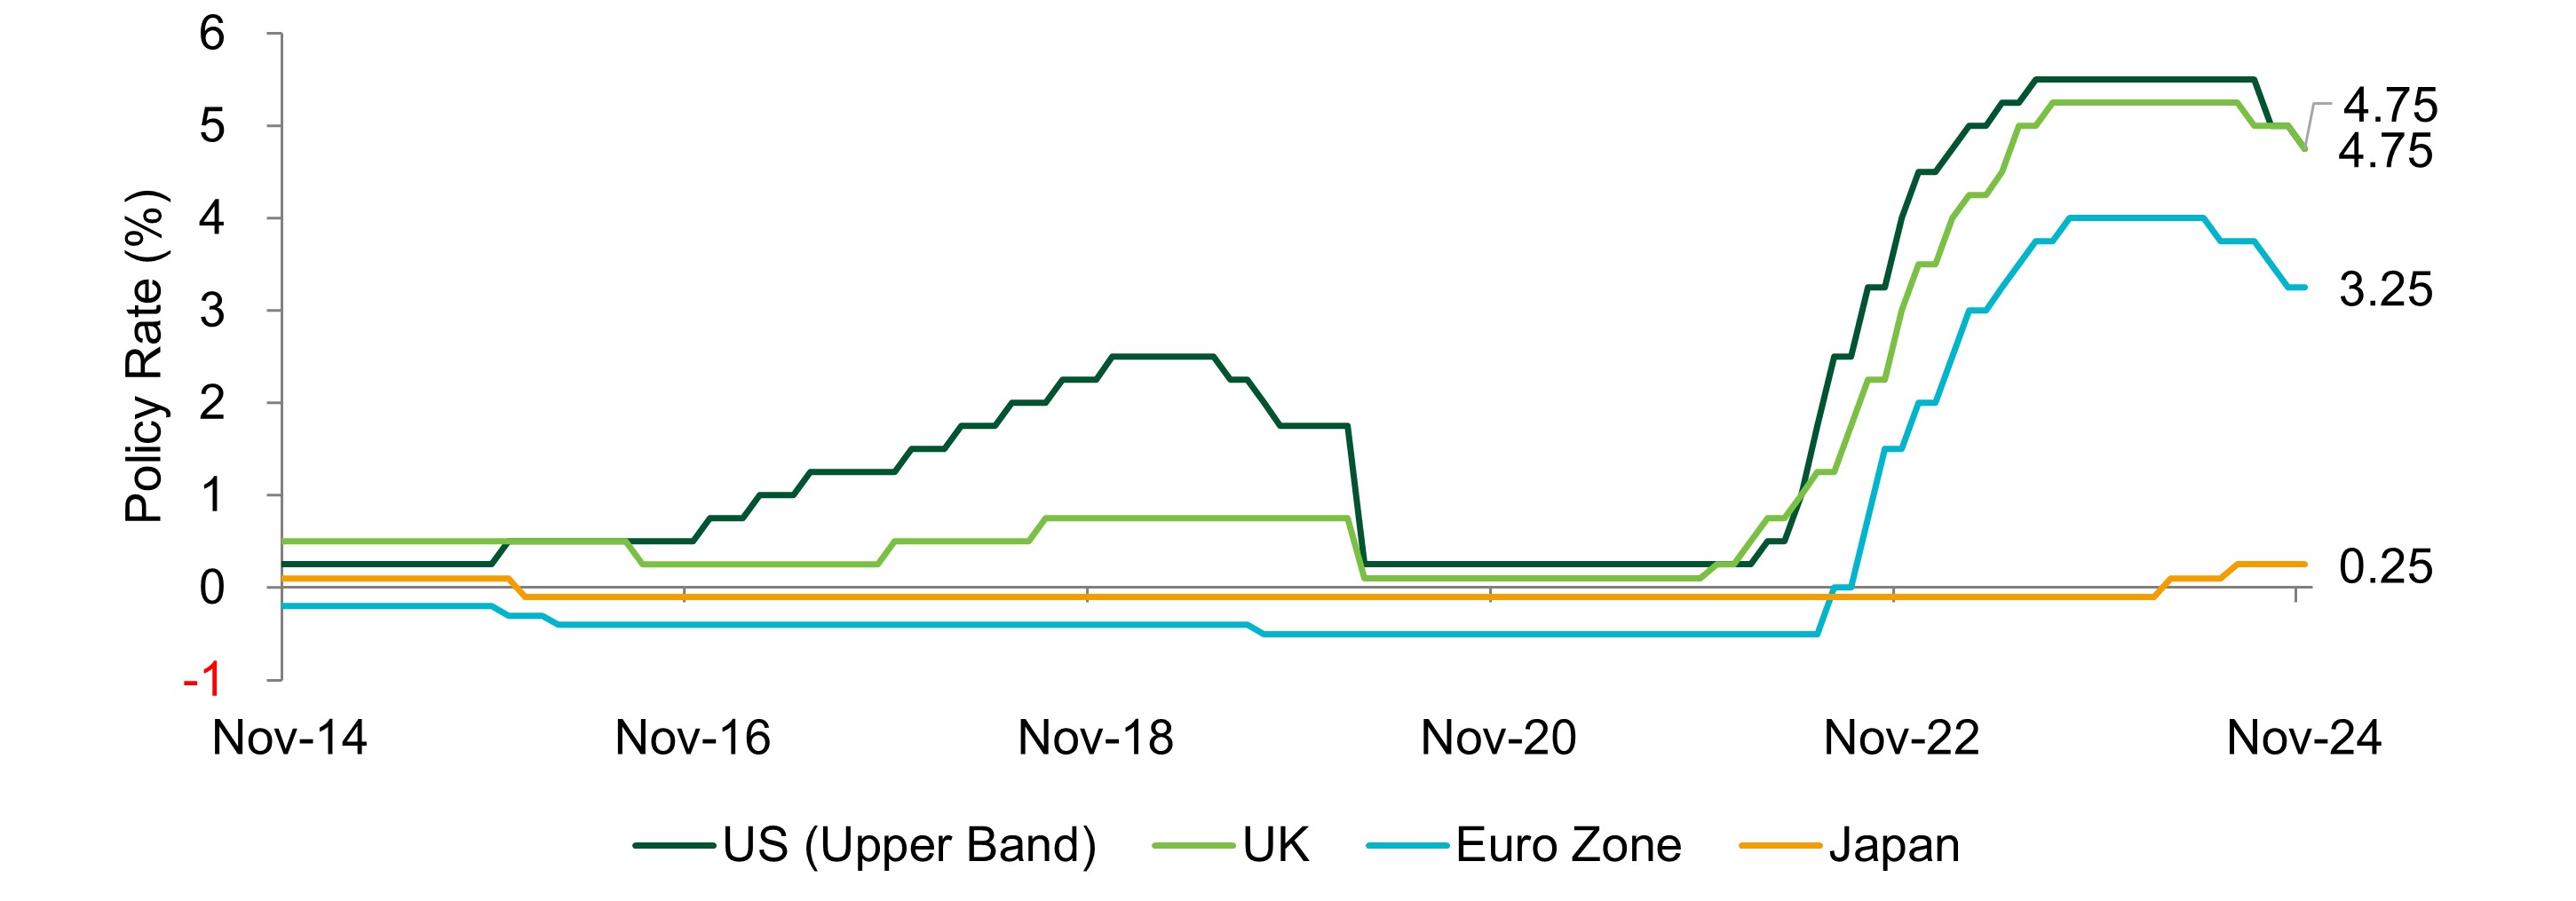
Source: Insight and Bloomberg as at 8 November 2024.
- The global easing cycle continued this week with the Bank of England and Federal Reserve lowering their rates to 4.75%. While Japan remains a relative outlier, with more hikes expected over the next year, the combination of easing financial conditions and fiscal impulse in the US is constructive for risk assets.
- The portfolios have been adding upside exposure to equities, looking to capitalise from a US led rally into year end.
Chart of the week
Trump media's surge against US equity and EU tariff woes against European equities
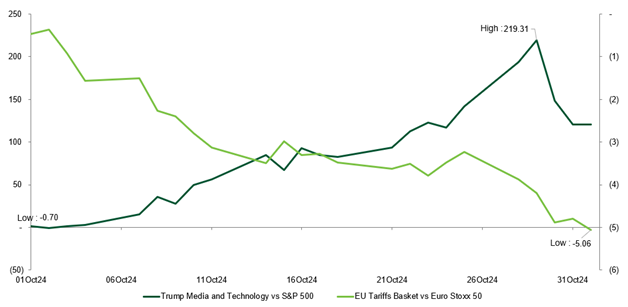
Source: Insight Investment, Barclays and Bloomberg as at 1 November 2024.
- As we race towards the US elections, markets are likely to experience increased volatility driven by the expected divergent policies of either a Trump or Harris victory. Whilst it is still a close call over who will win, over recent weeks we have seen a shift in market sentiment, partly reflected in the contrasting performance of assets. For example, Trump Media’s outperformance relative to the broader S&P 500 has seen gains, whereas stocks that could be most negatively impacted by tariffs and any trade war have struggled.
Significant market moves this week
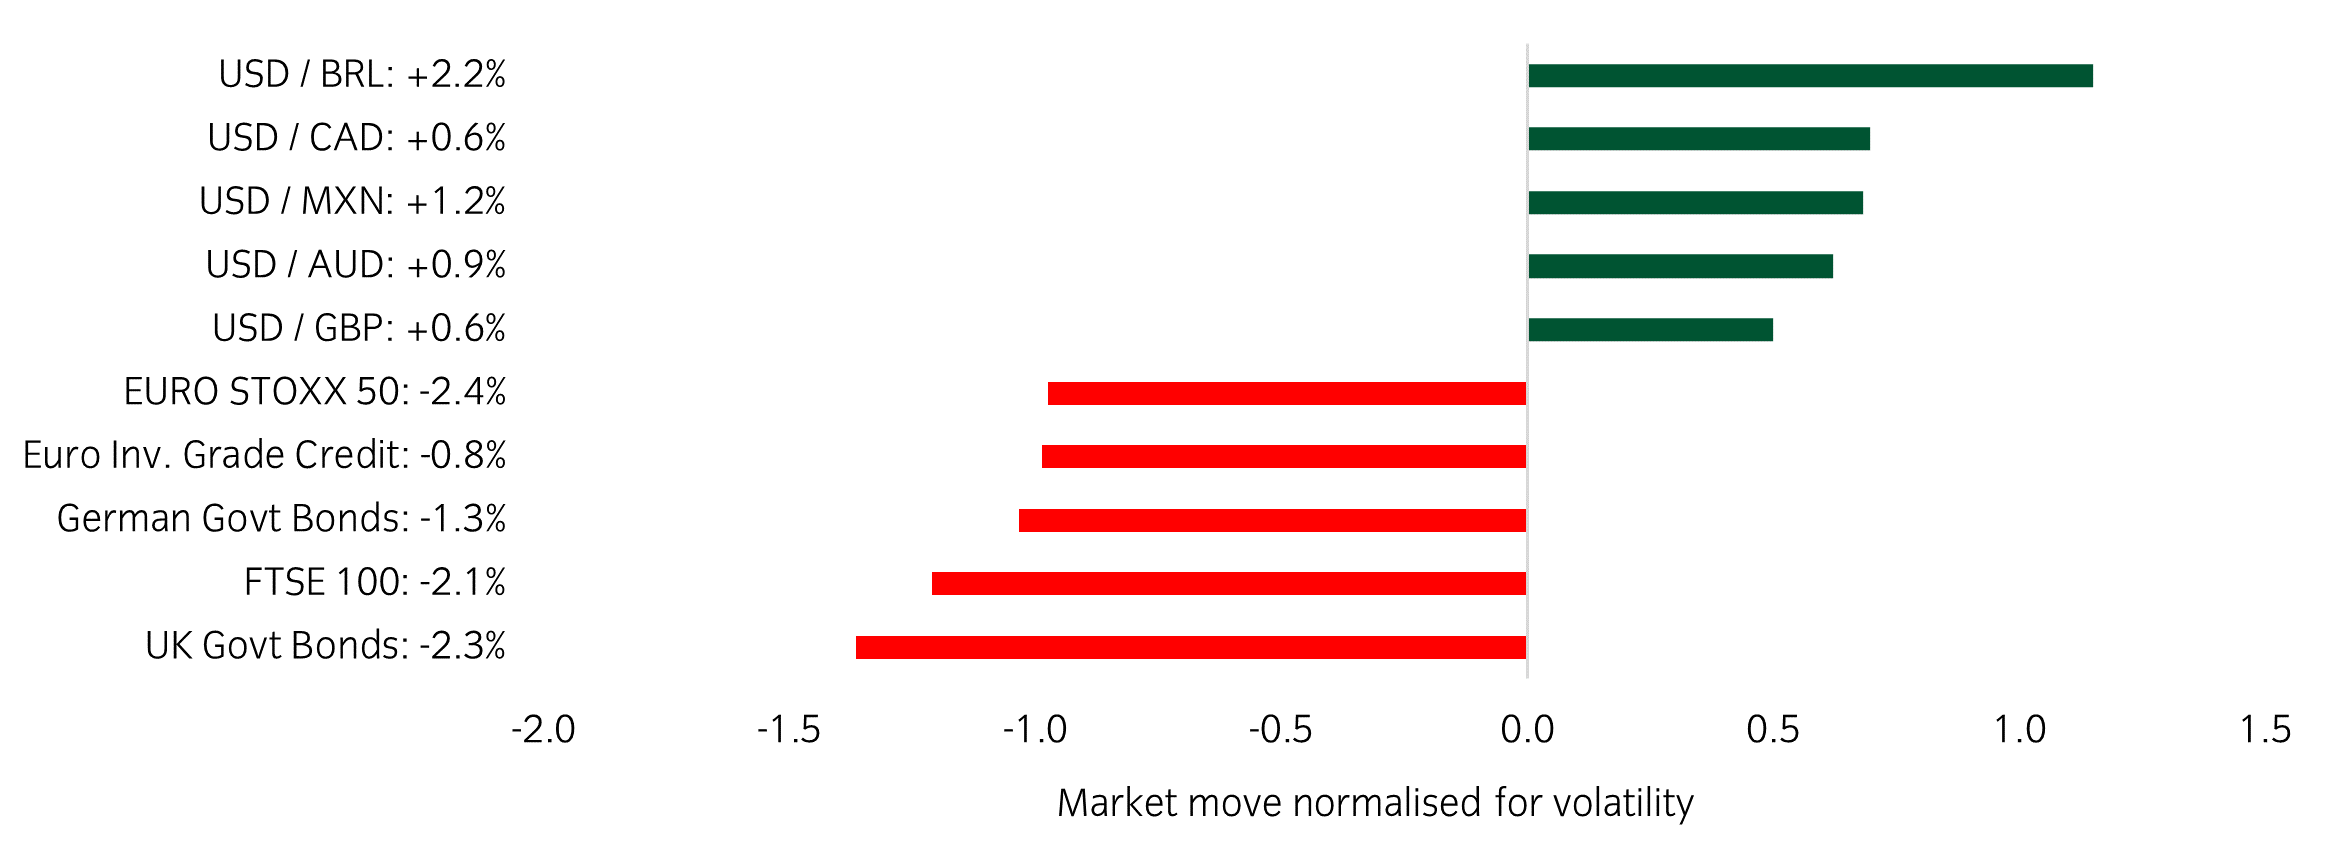
Source: Bloomberg and Insight as at 1 November 2024. The price movement of each asset is shown next to its name. The data used by the bar chart divides the price movement by the annualised historical volatility of each asset.
Winners & losers: The US dollar continued its strong run this week, while UK equity and government bonds have suffered after the Autumn Budget announcement.
Over the past week, several things caught our eye:
- As of today, 73.5% of the S&P 500's market cap has reported, including six of the 'Magnificent 7' companies. For these six companies, price reaction to the results announcements was mixed. Tesla, Alphabet and Amazon saw a positive reaction, while reaction to the results from Microsoft, Apple and Meta was negative.
- On Wednesday, UK’s Labour government announced its Autumn Budget with measures to bridge a £22 billion fiscal gap. It aims to raise approximately £40 billion from tax increases while easing borrowing limits to fund growth-oriented investment. Gilts and the FTSE 100 Index struggled immediately after, although a recovery is partially underway on Friday.
- Ahead of the Fed’s decision next week, the US jobs report was weaker than expected, although the data is challenging as a result of Hurricane Milton’s impact.
Asset allocation observation
SPX implied move
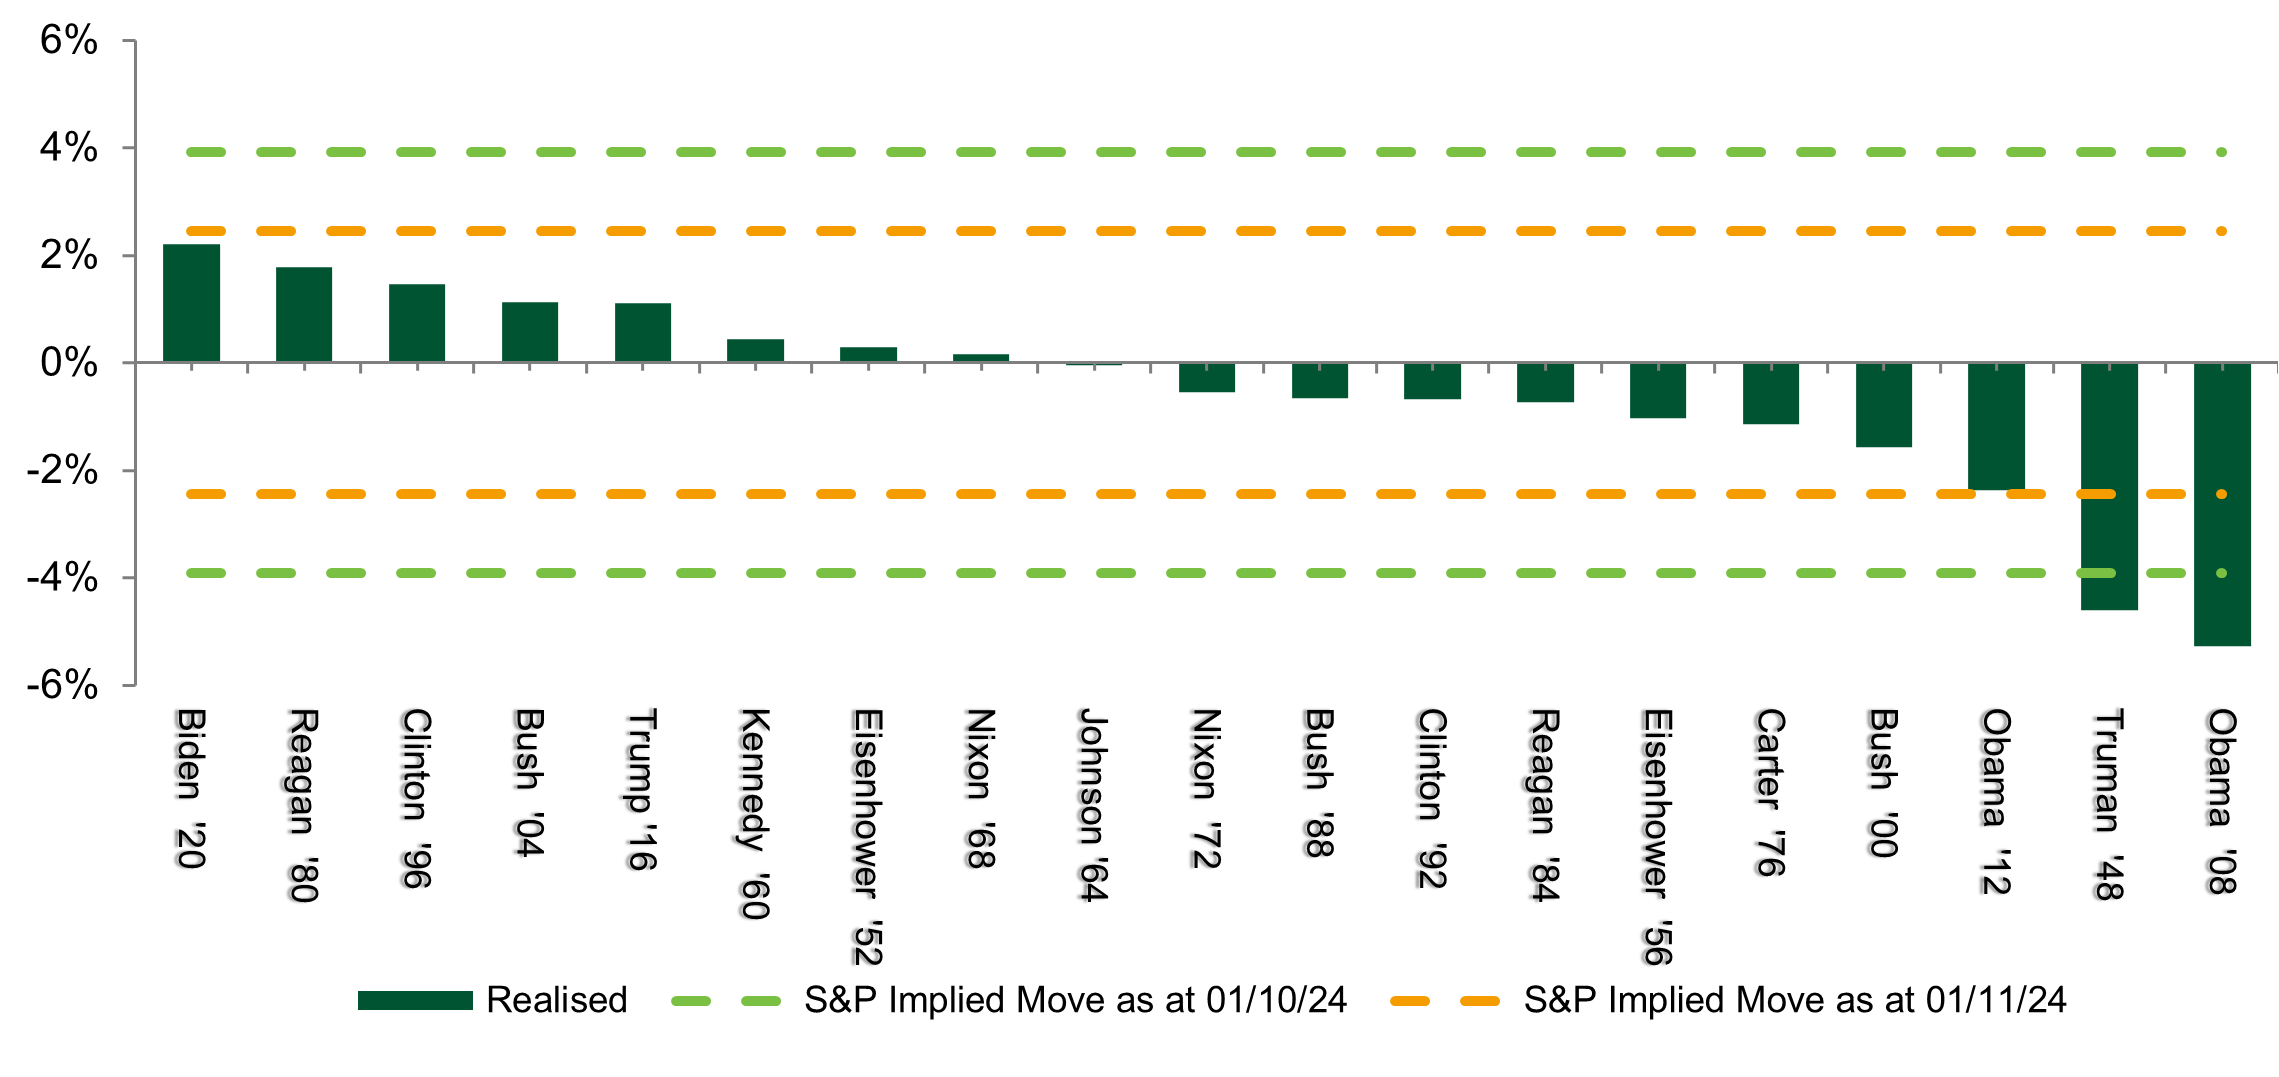
Source: Insight and Bloomberg as at 1 November 2024.
Most read
Global macro, Currency


June 2023
Global Macro Research: 30 years in currency markets
Multi-asset


January 2025
Multi asset chart of the week
Global macro


January 2022
Global Macro Research: Asset allocation, growth and inflation cycles
Global macro, Fixed income


October 2023
 Australia


