Australia


Chart of the week
PMIs suggest manufacturing activity remains depressed
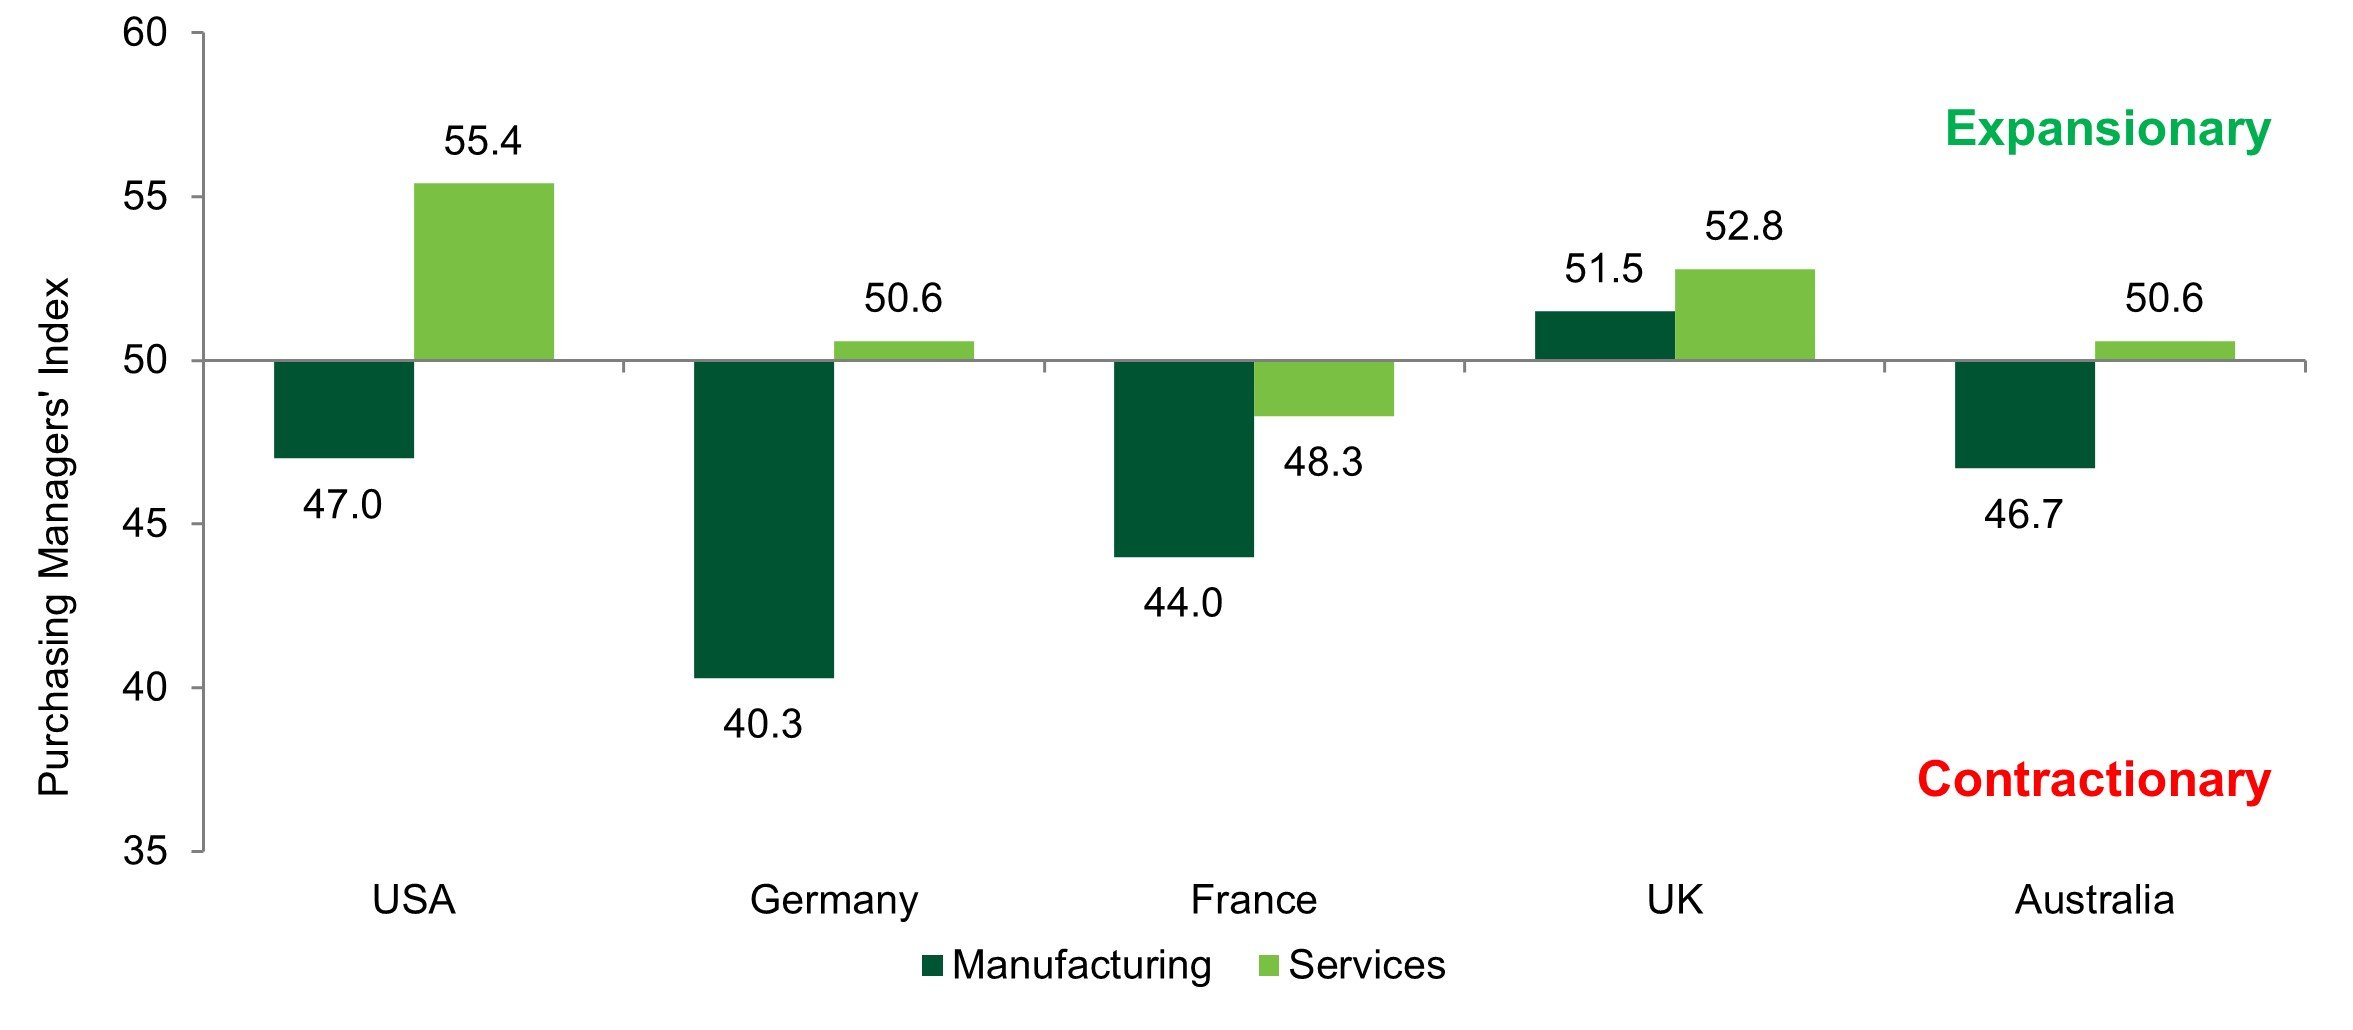
Source: Insight Investment and Bloomberg as at 27 September 2024.
- The latest set of flash purchasing managers indices (PMIs) continued to paint a negative picture of global manufacturing activity. Most notable was Europe, with German PMIs reaching levels typically associated with a recession. The outlook remains bleak too, with the ratio of new orders to inventories (often considered a leading indicator of the series) trending lower.
- The counterbalance to weak manufacturing activity has been a resilient service sector, with most services PMIs in or close to expansionary territory.
Market watch
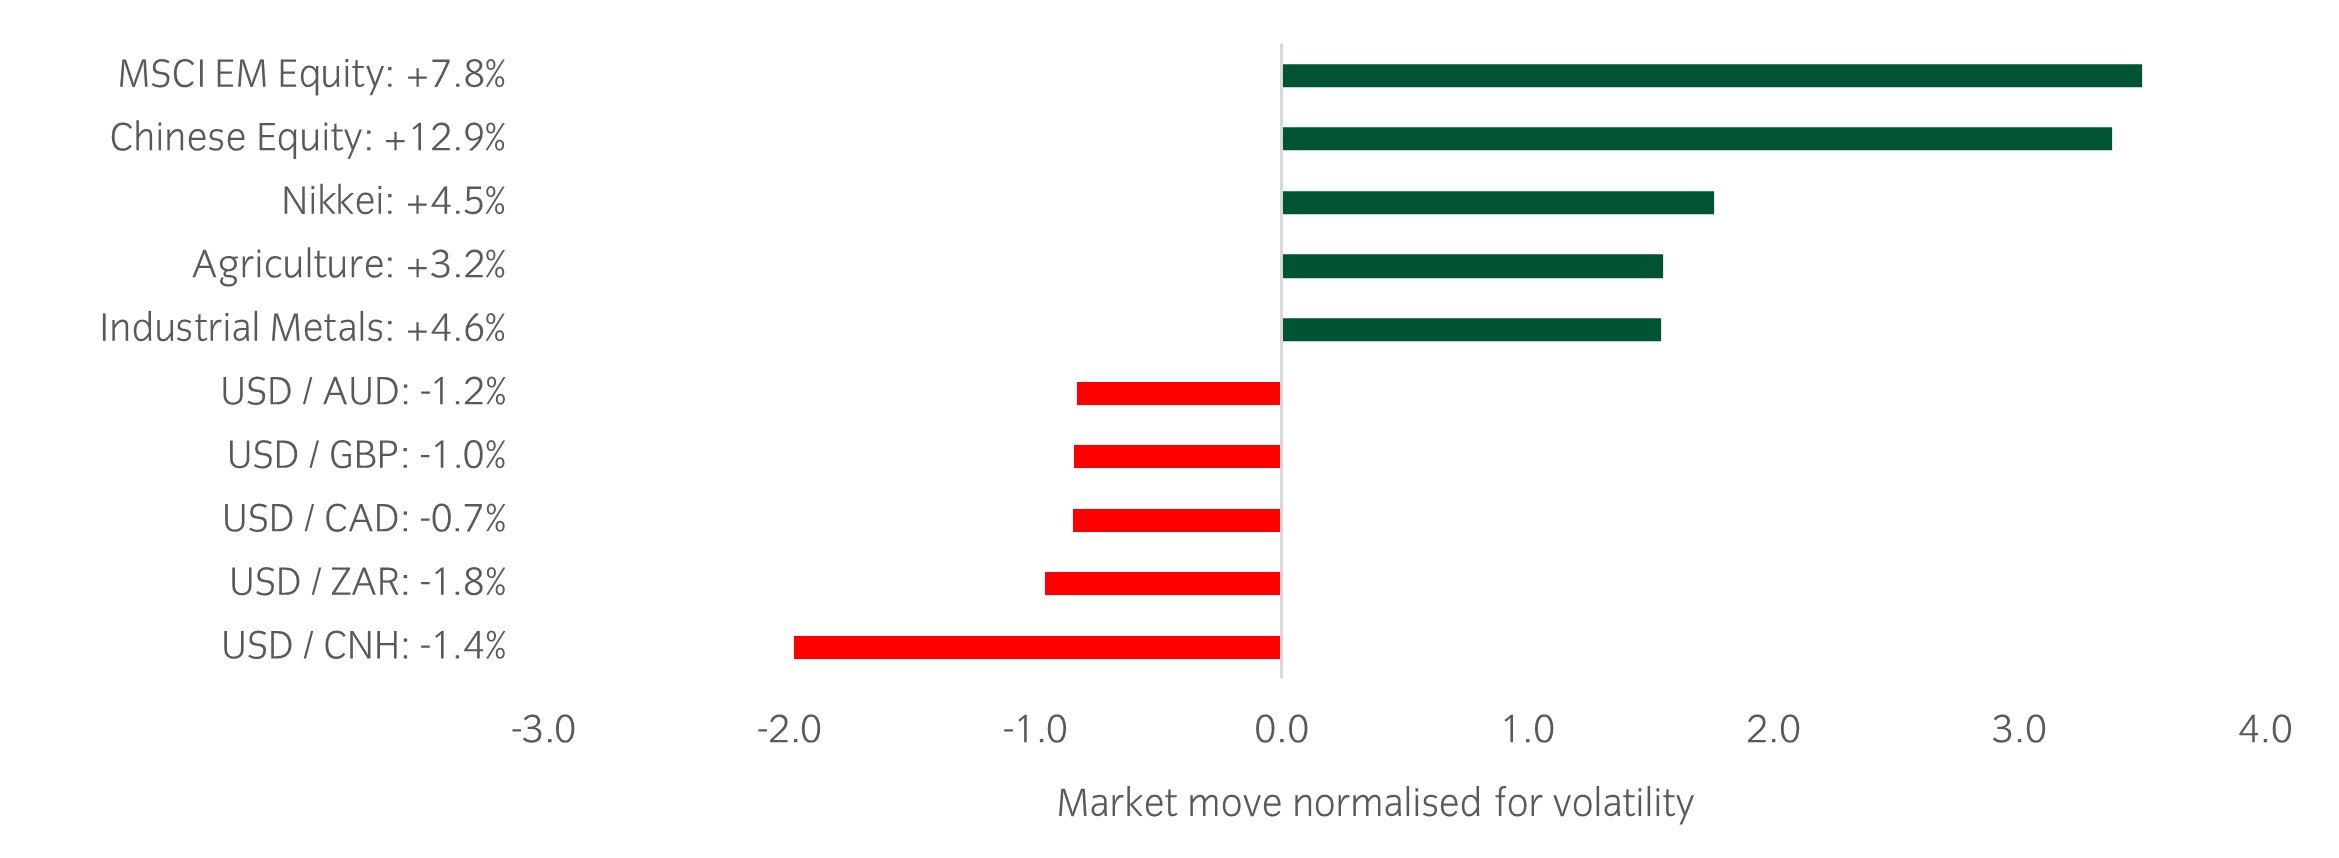
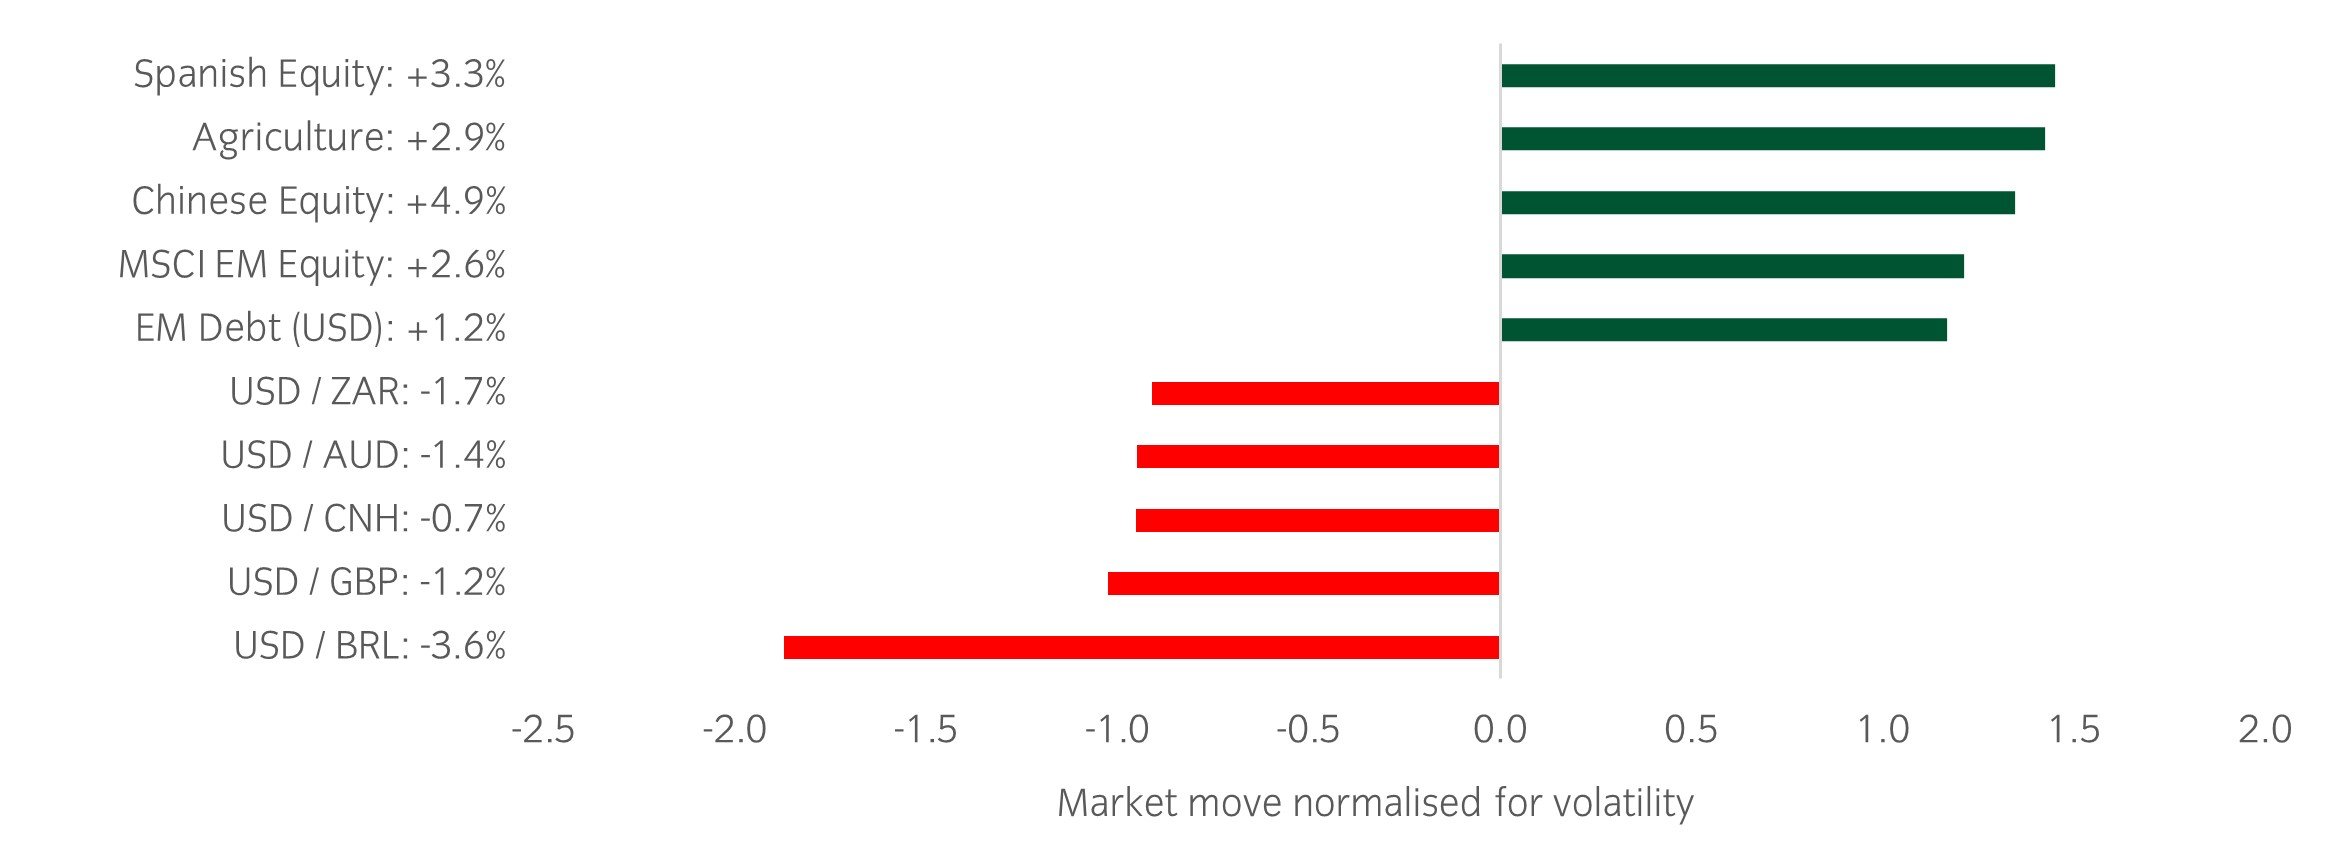
Source: Bloomberg and Insight as at 27 September 2024.The price movement of each asset is shown next to its name. The data used by the bar chart divides the price movement by the annualised historical volatility of each asset.
Over the past week, several things caught our eye:
- A ramp up in Chinese stimulus measures dominated market sentiment this week, with announcements from Tuesday through Thursday. As a result, the much unloved Chinese equity market bounced hard, recording a 13% gain on the week amid improved sentiment and a short squeeze.
- The flash manufacturing PMIs for September disappointed with most indices coming in below expectations. Most notably was a post-Olympic drop in French services (48.3 vs 53.1 expected and 55 prior). This was outweighed however by the expected second order effects from stimulus in China, with notable bounces in luxury names such as LVMH and Kering.
- Softer inflation data as US PCE came in below expectations on Friday, with the year-on-year number now at 2.2%.
Winners & losers: Very similar to last week as equity markets posted strong returns on the week, led by Asian markets, while the dollar weakened against more cyclical currencies.
Asset allocation observation
Downside inflation surprises
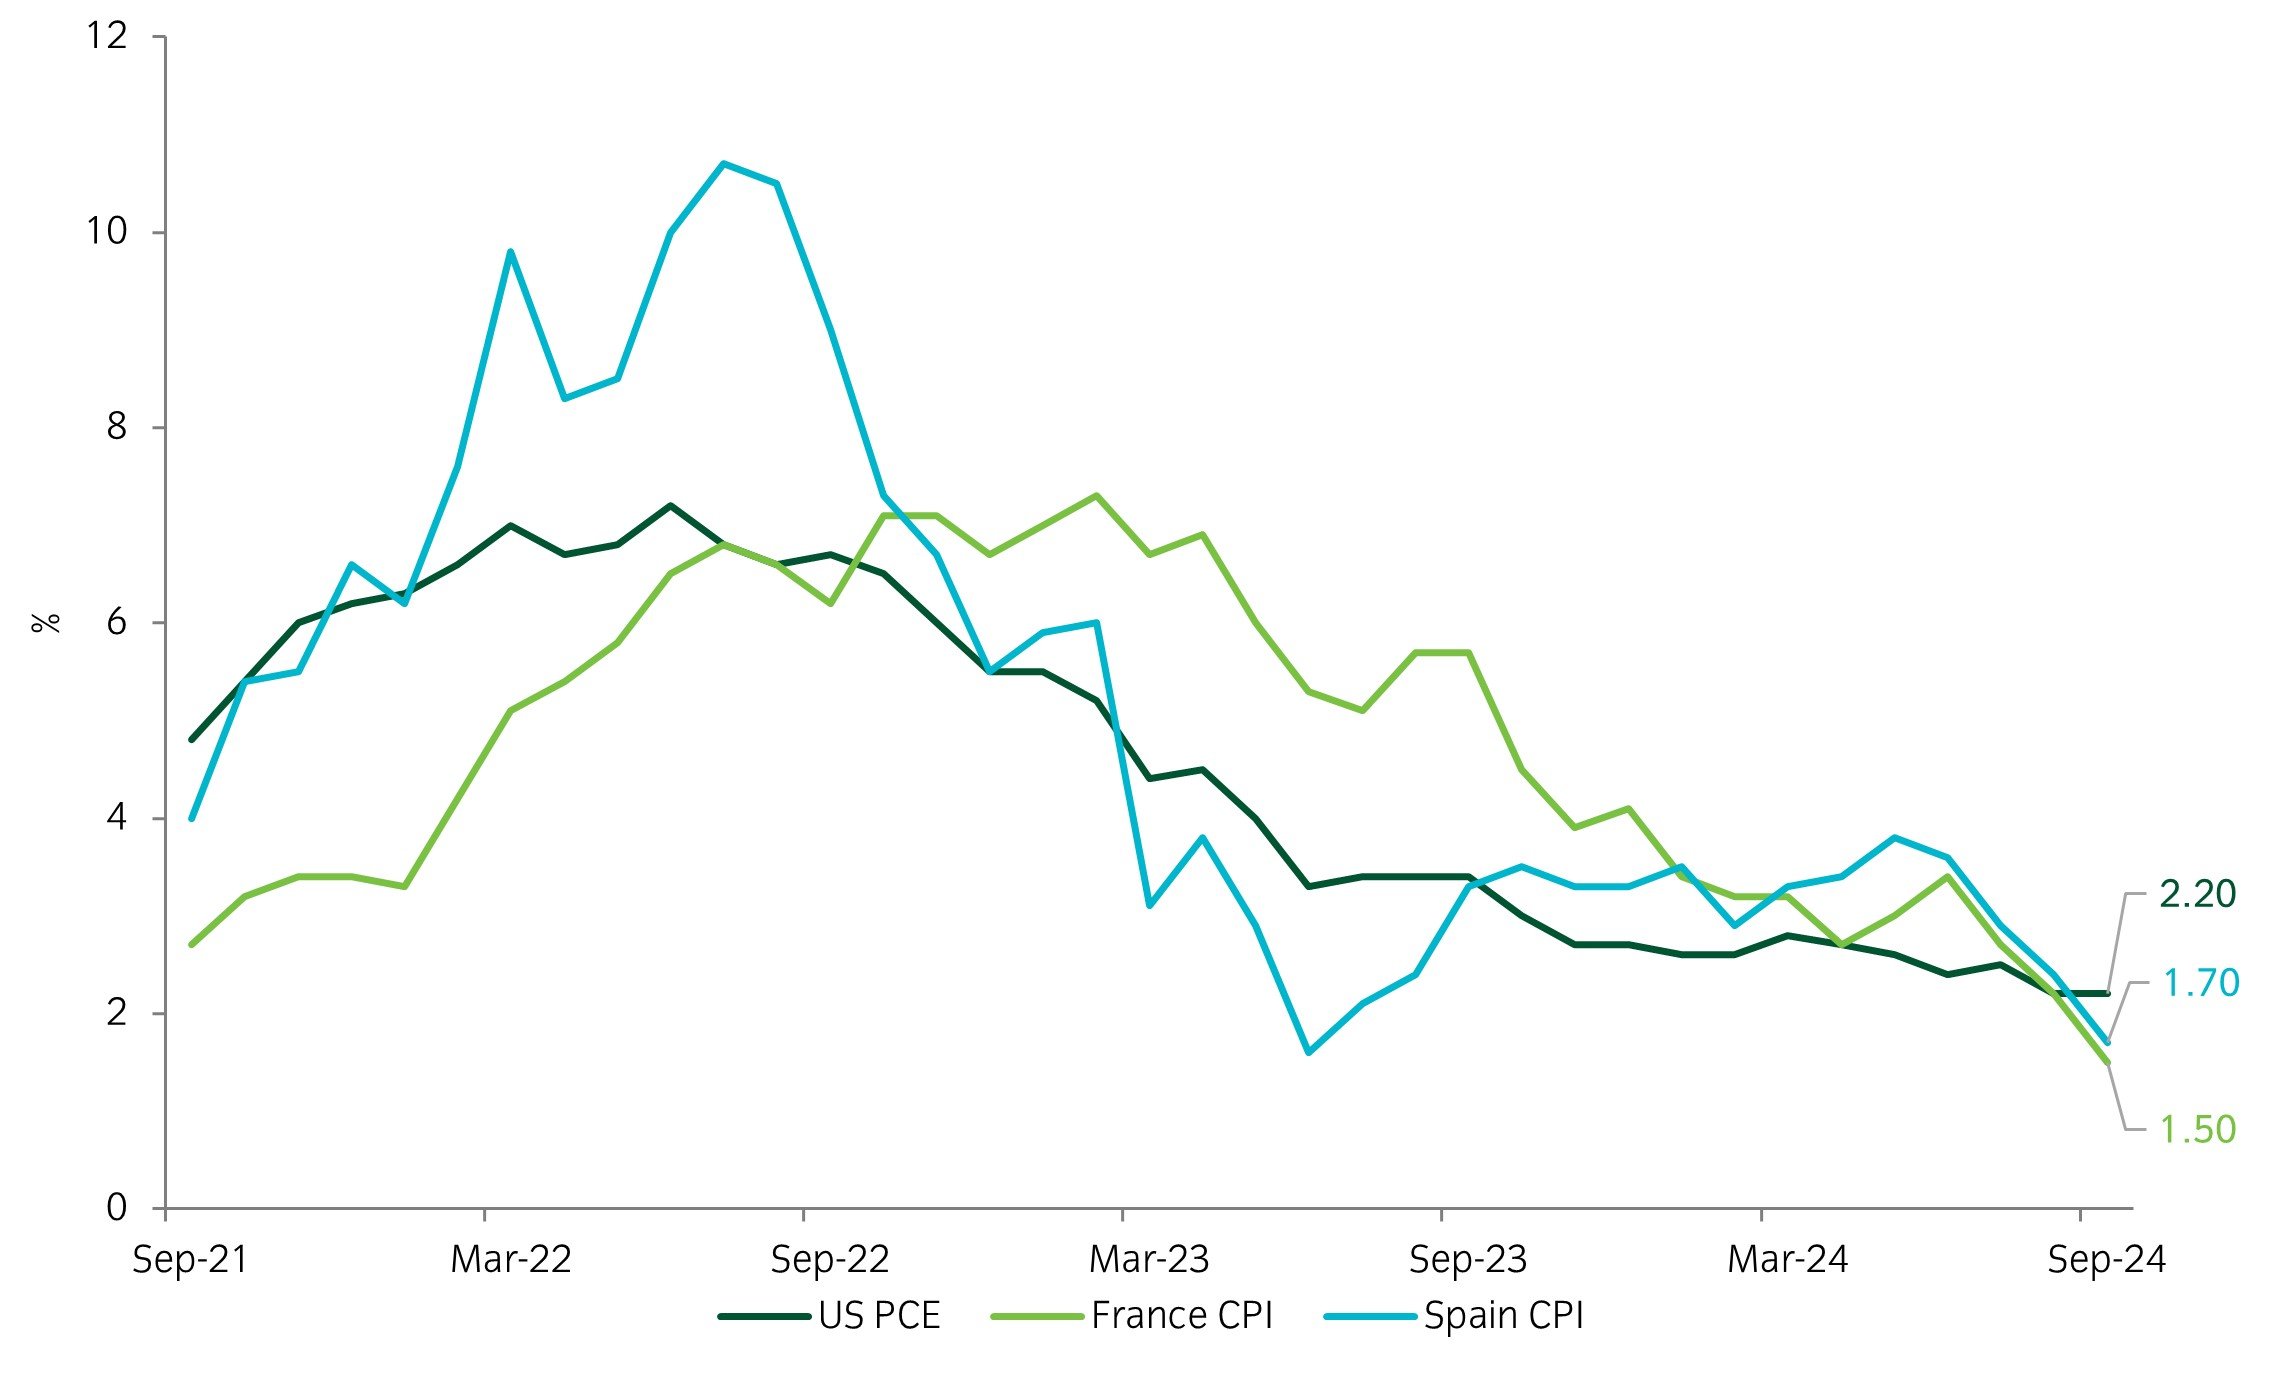
Source: Insight and Bloomberg as at 27 September 2024.
- We have been gradually increasing our duration in recent weeks, as we believe that central banks have moved on from inflation as their primary concern, to worrying about growth. This increases the diversifying impact of government bonds as we should see yields fall further if the growth data continues to decline (which at the same time would likely hurt equity markets).
- The inflation data this week will have provided comfort to central banks that they are right to shift their focus to growth. This was particuarly notable in the French and Spanish flash inflation prints, which both printed below 2% and well below expectations.
- We added duration in Europe and a EURUSD downside option trade to reflect the view that recent European data (both growth & inflation) argues for a more aggressive policy path from the ECB.
Chart of the week
Asset-class returns during US rate-cutting cycles
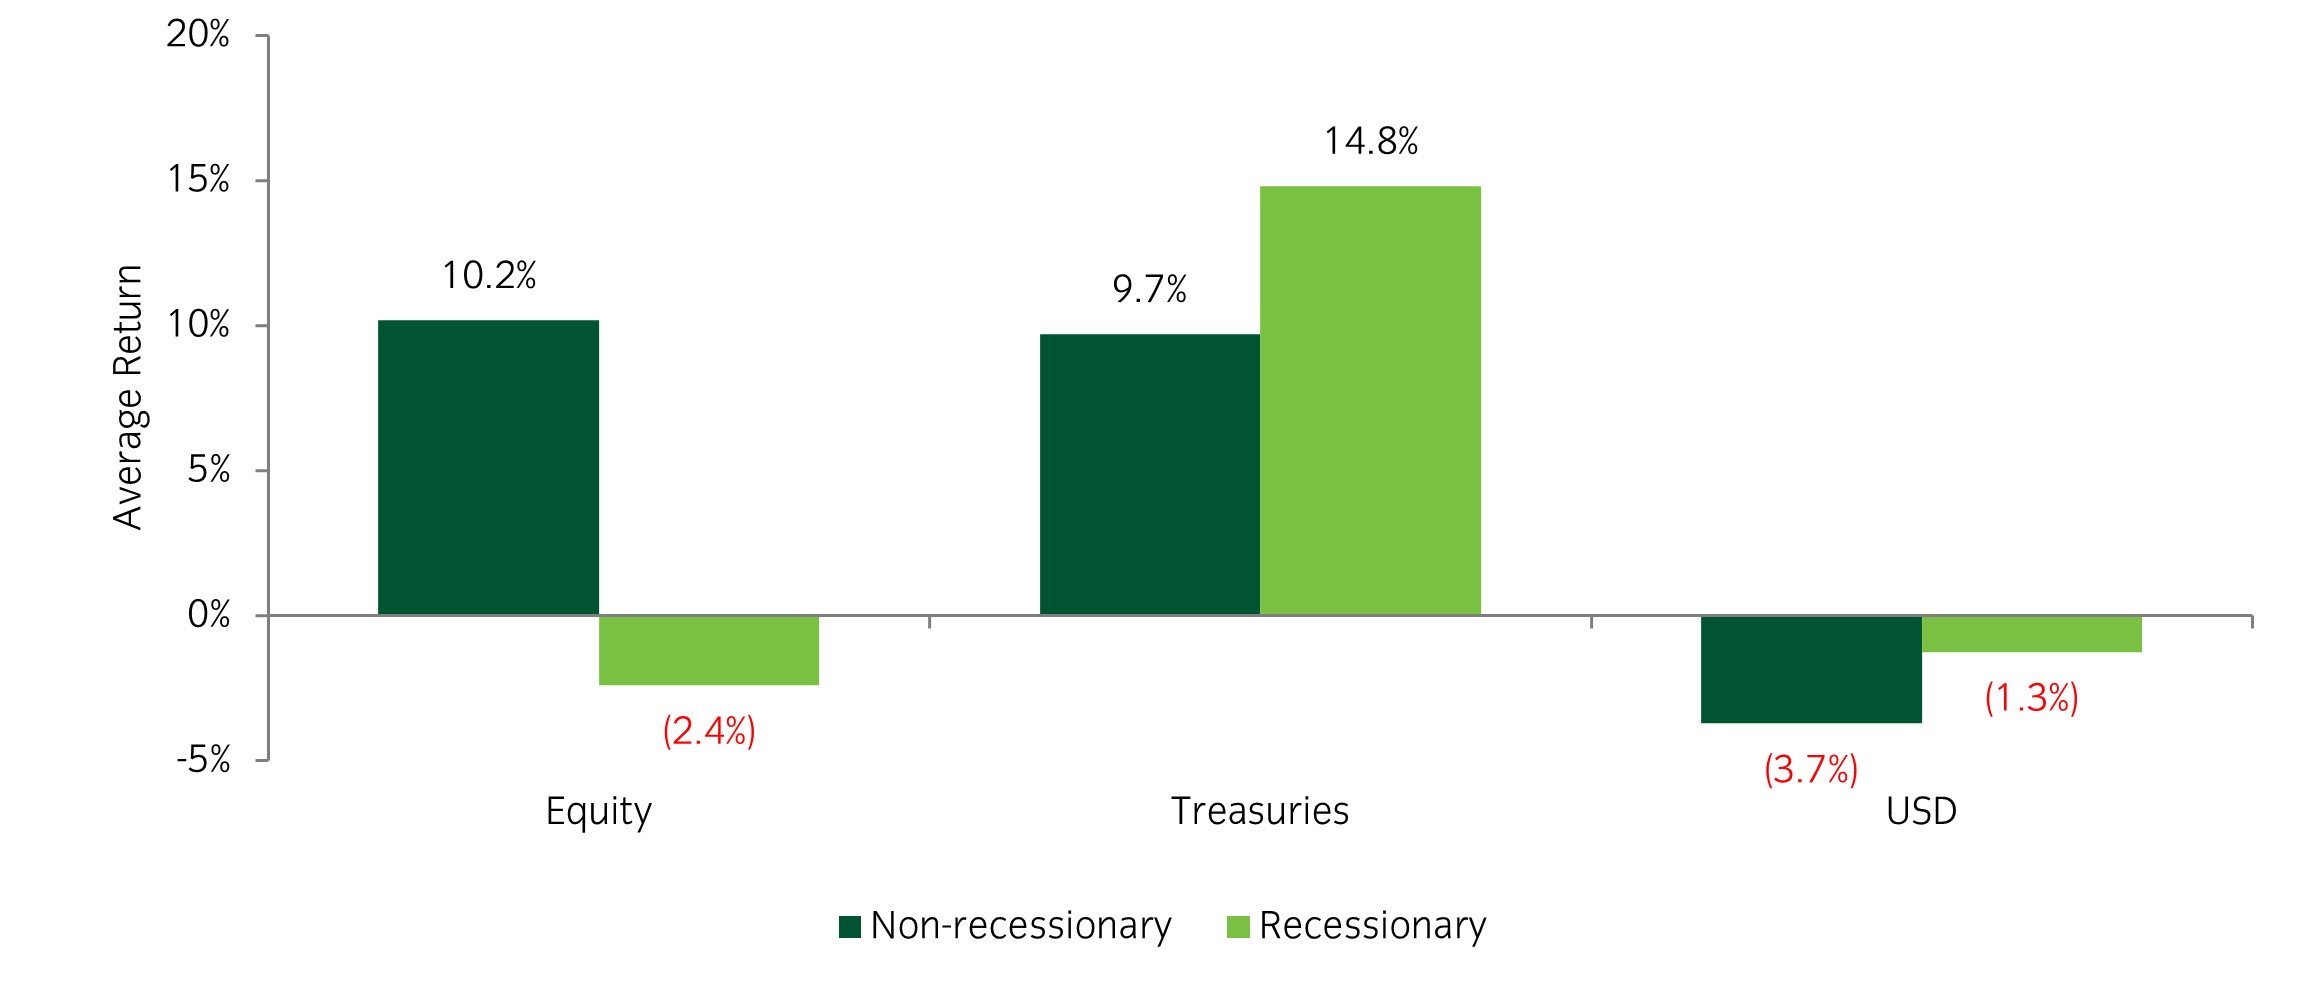
Source: Insight Investment and Bloomberg as at 20 September 2024.
- Often what determines the reaction function of markets to a Fed cutting cycle is the economic environment. If the cutting cycle occurs during a non-recessionary environment, then risk assets tend to perform well. If, however, the cutting cycle takes place against a recessionary backdrop, risk assets tend to perform poorly.
- Cutting cycles tend to be very positive, even in non-recessionary environments, for Treasuries, and become periods of USD weakness.
Market watch
Source: Bloomberg and Insight as at 20 September 2024. The price movement of each asset is shown next to its name. The data used by the bar chart divides the price movement by the annualised historical volatility of each asset.
Over the past week, several things caught our eye:
- The highlight of the week was the Federal Open Market Committee (FOMC) meeting on Wednesday, with the market split between whether a 25bp or 50bp cut was most appropriate. In the end, FOMC members voted for a 50bp cut, although other elements of the meeting were not as dovish. For example, this meeting saw the first dissent (a member voting against the group consensus) for the first time since 2005. This highlighted that members were not completely united behind a 50bp cut.
- Elevated volatility continued in Japanese markets as the yen and Japanese equity market remain correlated. Having briefly passed below 140/$ on early Monday, the yen steadily sold off, breaking above 144/$ on Friday. This allowed the Nikkei to post a solid 4.75% return.
Winners & losers: Equity markets posted strong returns on the week led by Asian markets, while the dollar weakened against more cyclical currencies.
Asset allocation observation
Market moves since Fed Meeting
Source: Insight and Bloomberg as at 20 September 2024.
- The initial 1% equity market reaction to the Fed’s 50bp cut was short lived as traders ‘sold the news’ and markets eventually closed lower on Wednesday. It wasn’t until the Asian session overnight that risk appetite surged, with a clear outperformance in these markets.
- We have tactically added emerging market and small-cap upside option trades, as these markets are likely to benefit from an easier rate environment.
Chart of the week
The market is undecided whether the Fed cuts by 0.25% or 0.50% next week
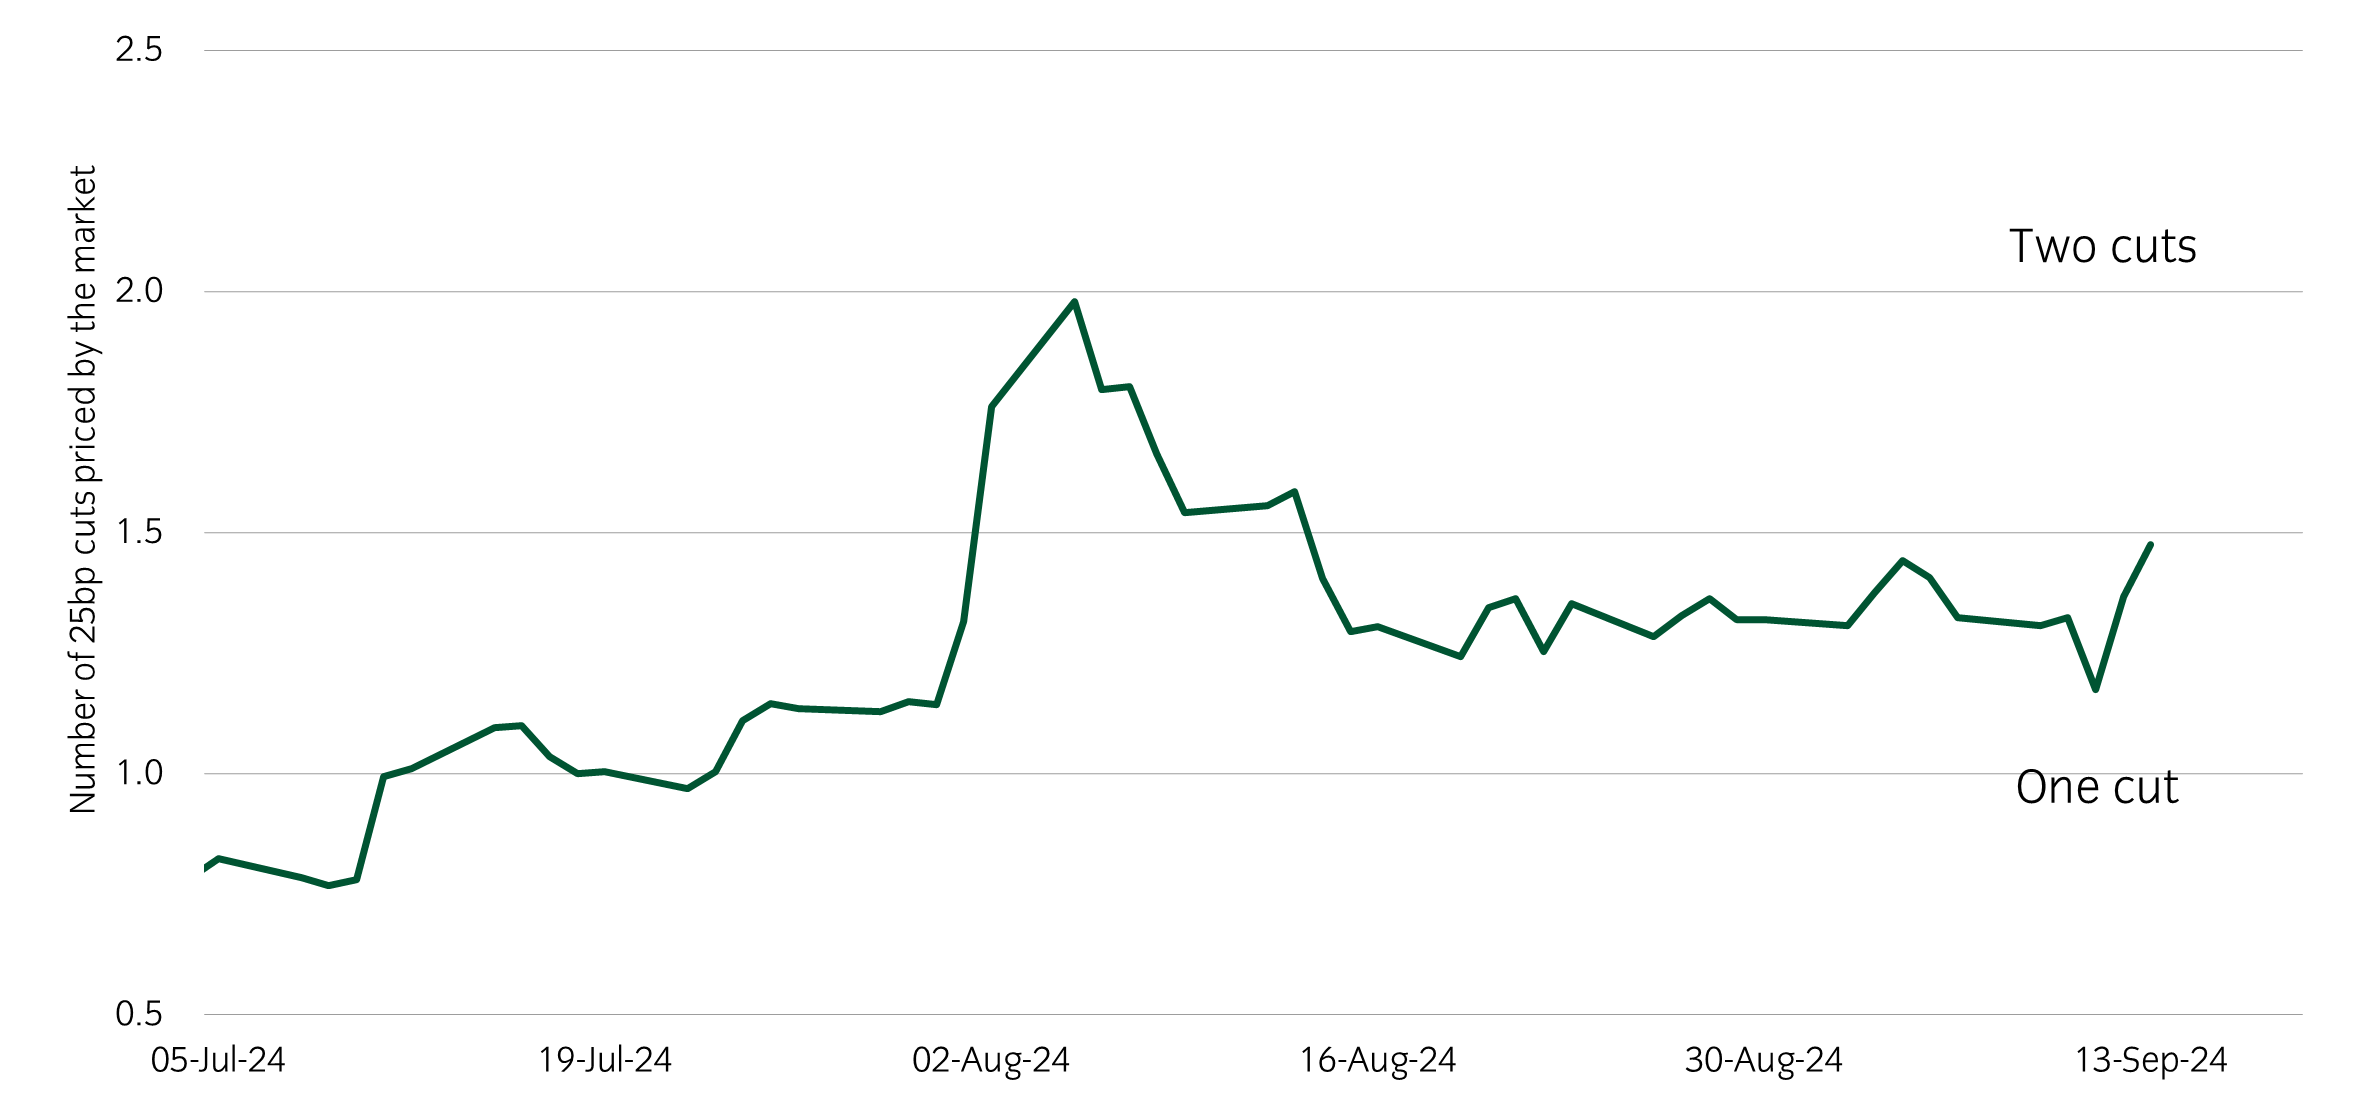
Source: Insight Investment and Bloomberg as at 13 September 2024.
- The market has fully priced a 25bp cut since early July, on the back of a softening US labour market and inflation continuing to fall. What has been in question though is whether the Fed cuts by 25bp or 50bp. During the market turmoil of early August, the market moved to fully price a 50bp cut. The subsequent market recovery and a slightly higher US Core CPI print on Wednesday saw market pricing move back towards only a 25bp cut. Over the last 24 hours, the Wall Street Journal (WSJ) and the Financial Times (FT) have both reported that a 50bp cut remains a possibility. If market pricing remains balanced, this would be the first meeting in years where there is significant uncertainty about the change in rates ahead of the decision.
Market watch
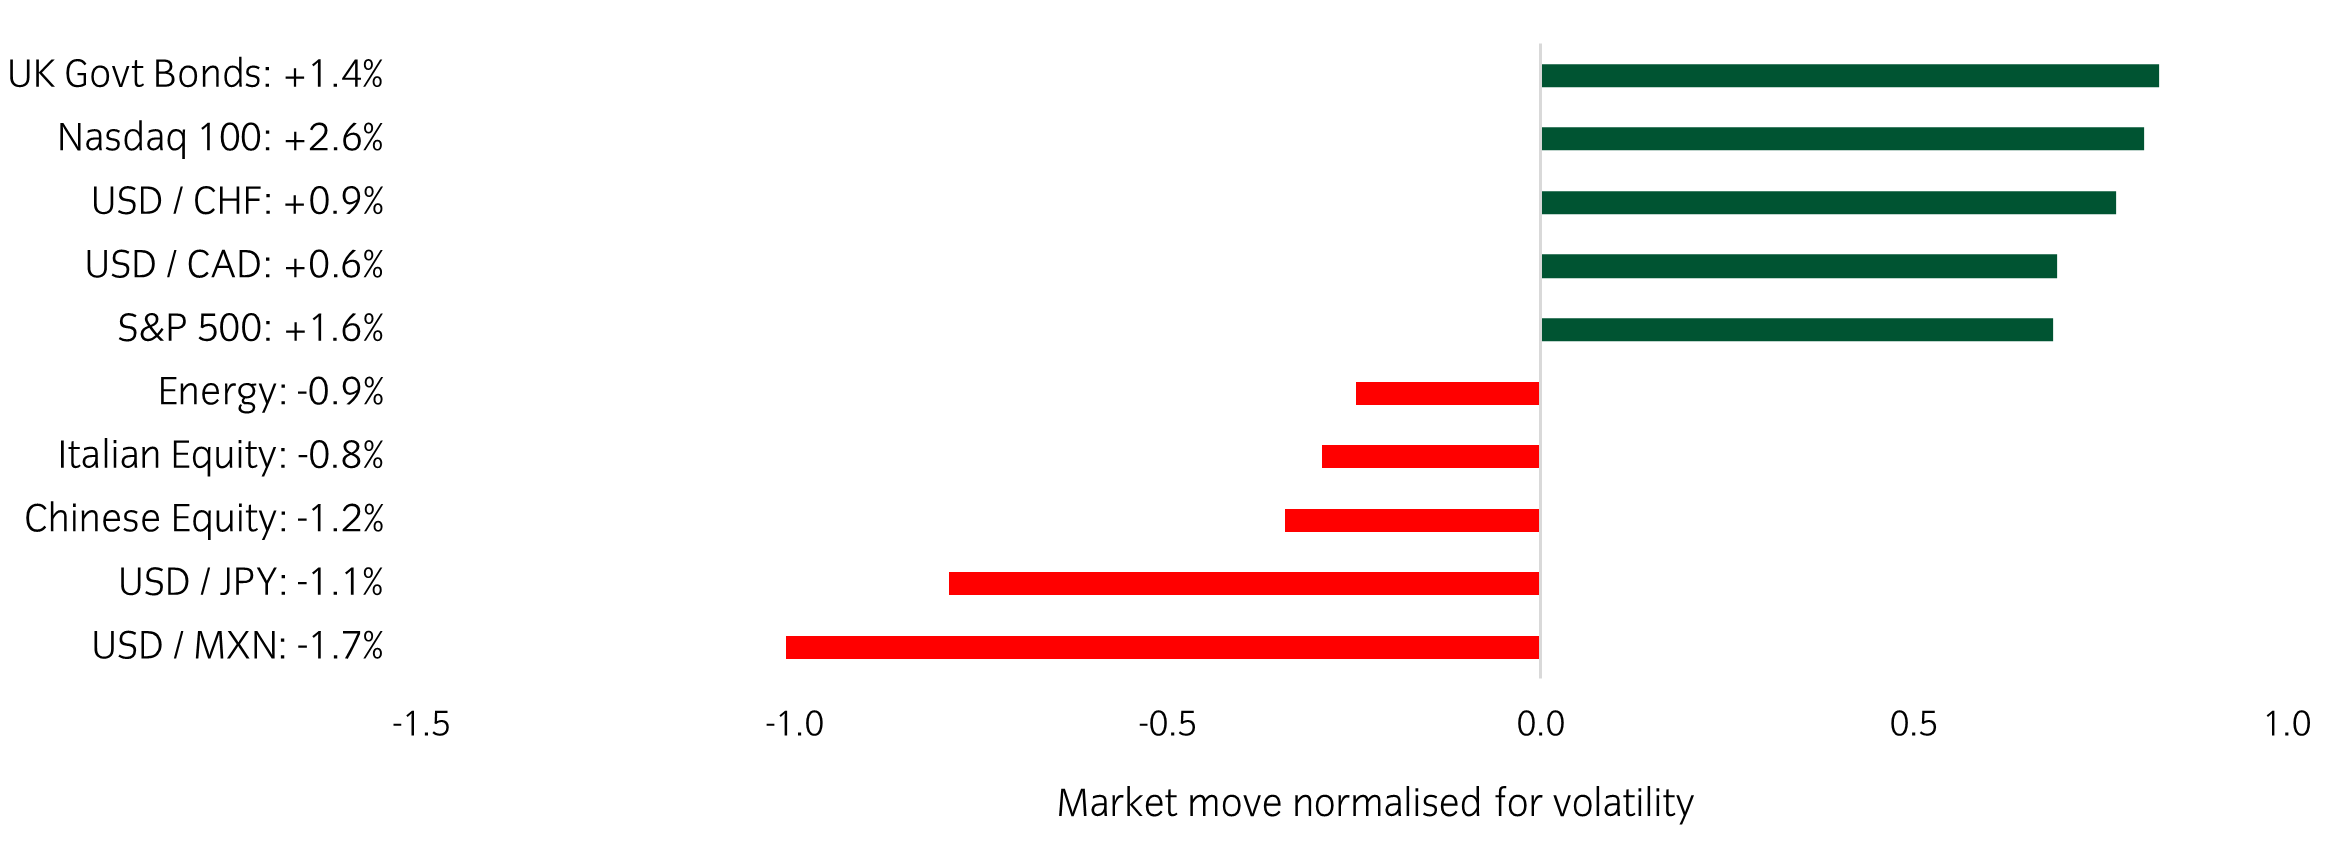
Source: Bloomberg and Insight as at 13 September 2024. The price movement of each asset is shown next to its name. The data used by the bar chart divides the price movement by the annualised historical volatility of each asset.
Over the past week, several things caught our eye:
- The primary market focus is on whether the Federal Reserve will implement a 25bp or 50bp rate cut next week. The US jobs report last Friday was broadly in line with expectations; however, on Wednesday, core inflation came in at the upper end of expectations. This led the market to favour a 25bp rate cut, although reports in the WSJ and FT saw market pricing shift again to become more balanced in terms of a 50bp cut.
- The Tuesday night presidential debate between Trump and Harris had little impact on presidential prediction rates. Trump’s support dipped by 1%, bringing him to 46%. However, Trump-related stocks such as Trump Media & Technology Group fell by 10.5%.
- On the other side of the world, the Bank of Japan signalled it is likely to continue raising interest rates if its inflation and economic targets are achieved. The yen is now trading at 140.9 against the dollar, marking its strongest level since 1 January.
Winners & losers: Government bonds have outperformed this week, while US equity has performed well at the same time.
Asset allocation observation
Defensives/Cyclicals basket has negative correlation to global equities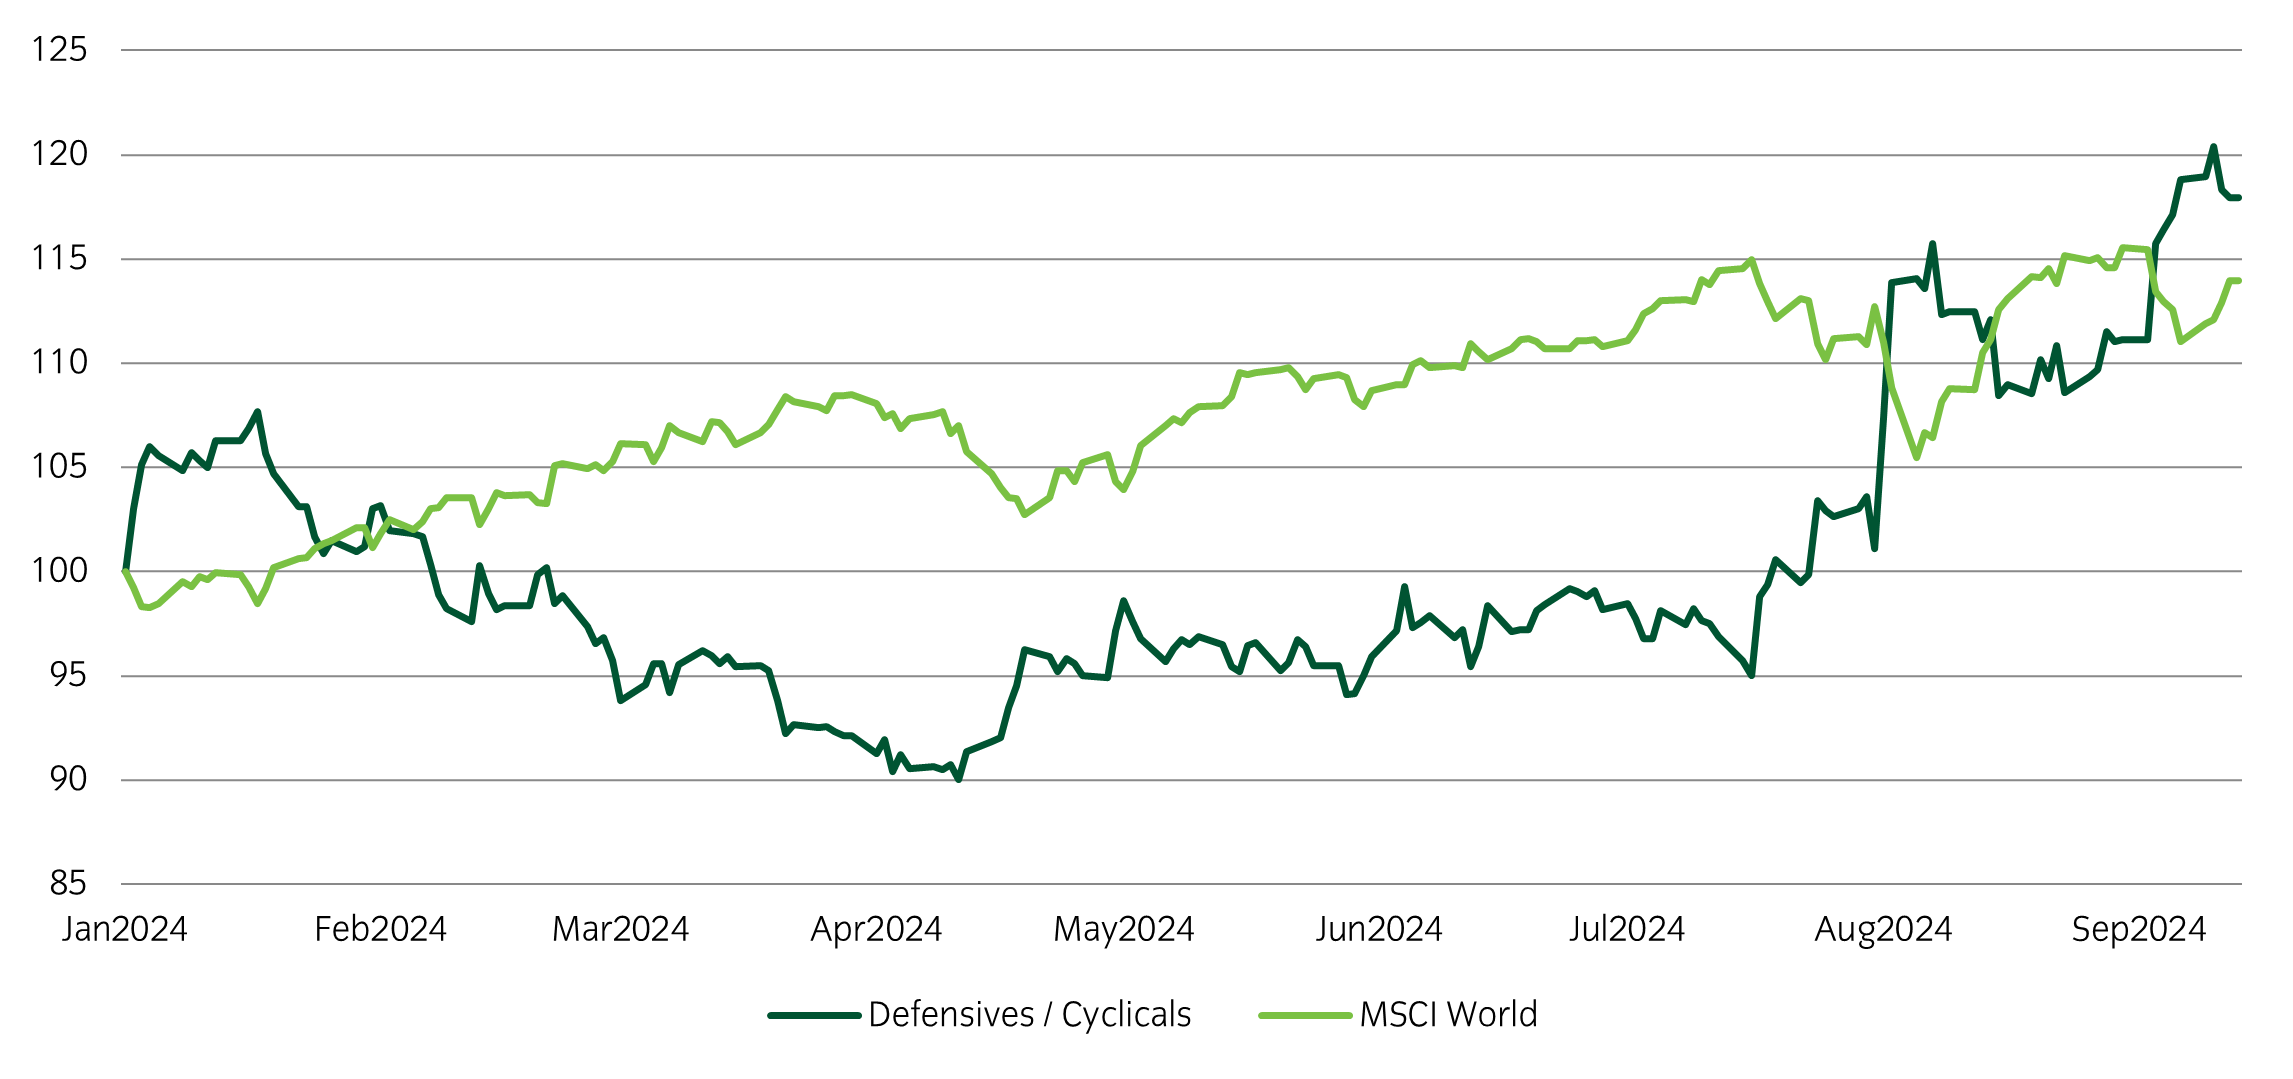
Source: Insight and Bloomberg as at 13 September 2024.
- Cyclical sectors such as technology, energy and industrials have underperformed defensive sectors, such as healthcare, consumer staples and utilities, for months now.
- In light of the potential risks to growth and weak seasonals, we have in portfolios a defensives vs cyclicals position to provide protection in the event of weaker-than-expected macro data. This is designed to buffer global equities and add an extra layer to protect our portfolios as it typically has a negative correlation to risk.
Chart of the week
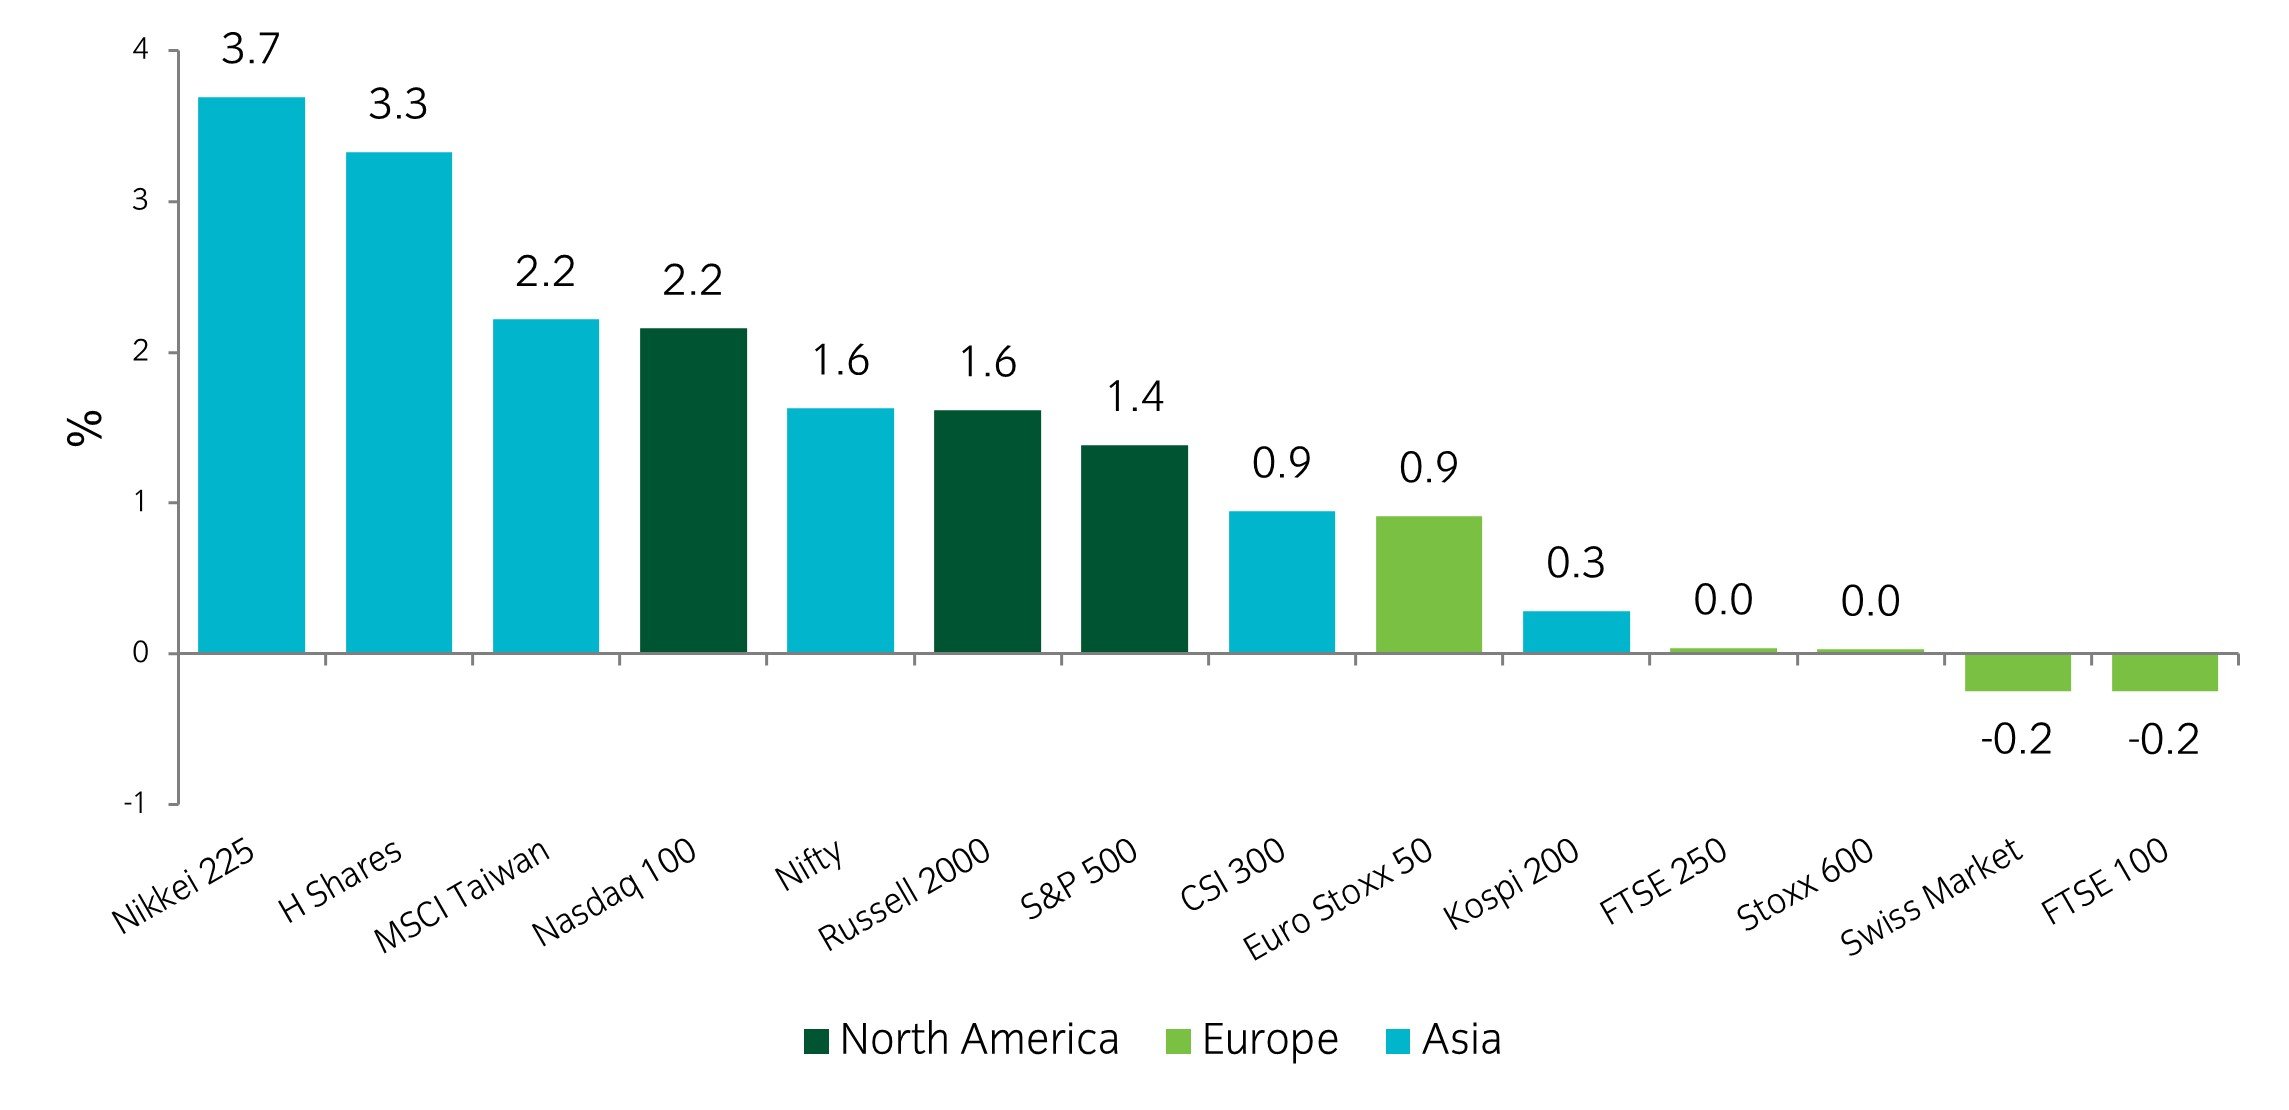
Most equity indices staged an impressive recovery in August after a weak start
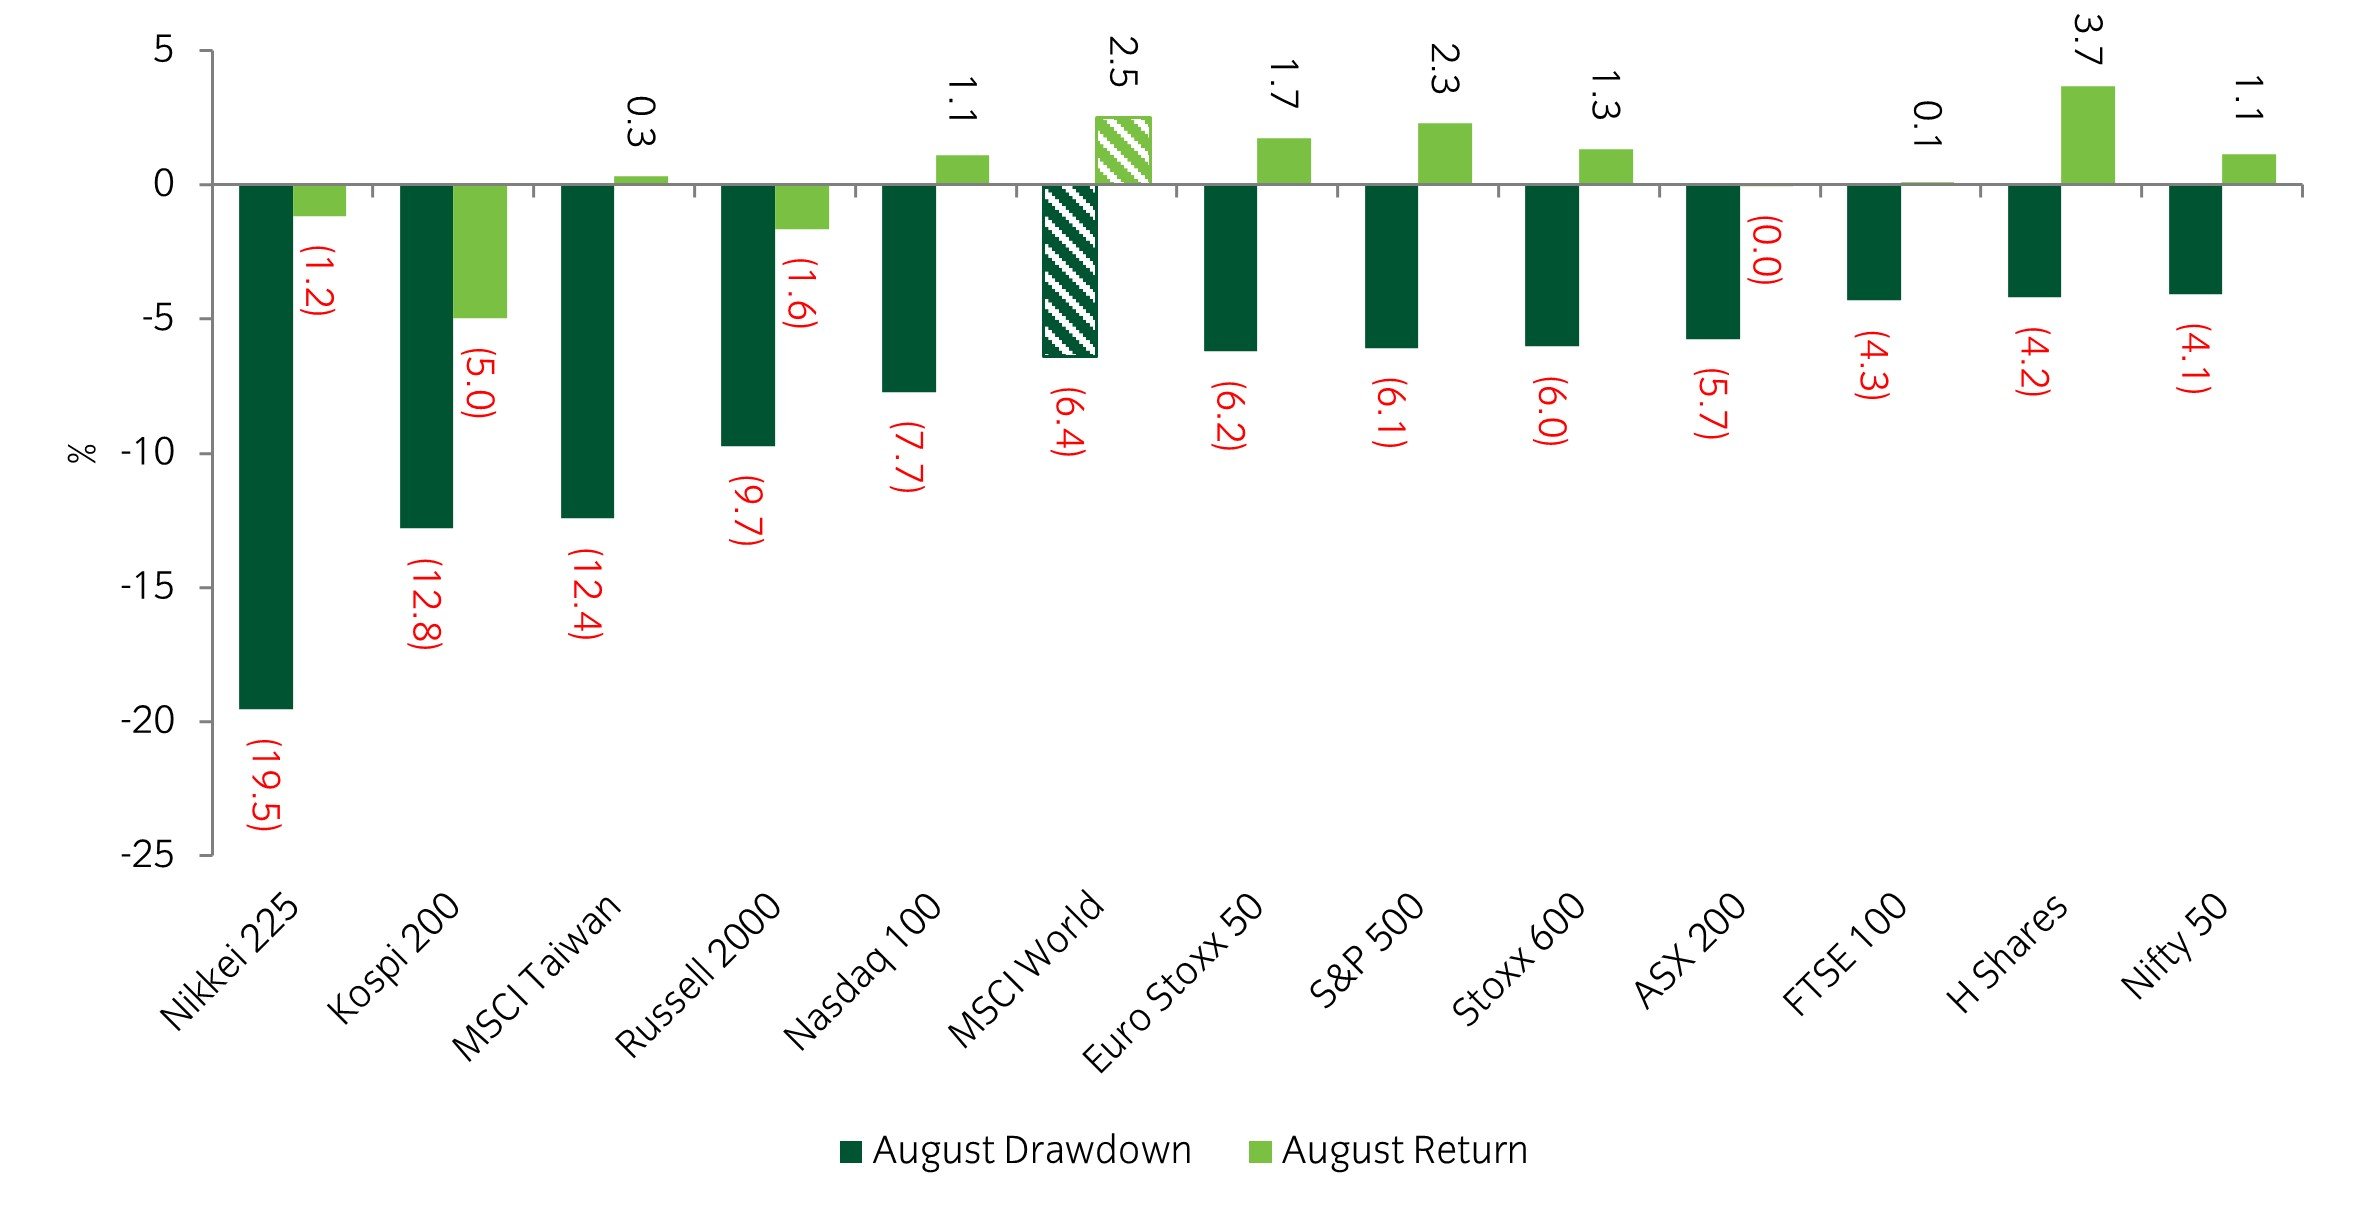
Source: Insight Investment and Bloomberg as at 31 August 2024.
- Marginally positive returns across equity markets in August masked significant intra-month volatility, with many indices down by more than 6% after the first few days of trading. Japanese equities were a stand-out, with the Nikkei 225 posting its worst 3-day performance on record. Volatility was also particularly high in Korean, Taiwanese, US Small Cap and semiconductor indices.
Market watch
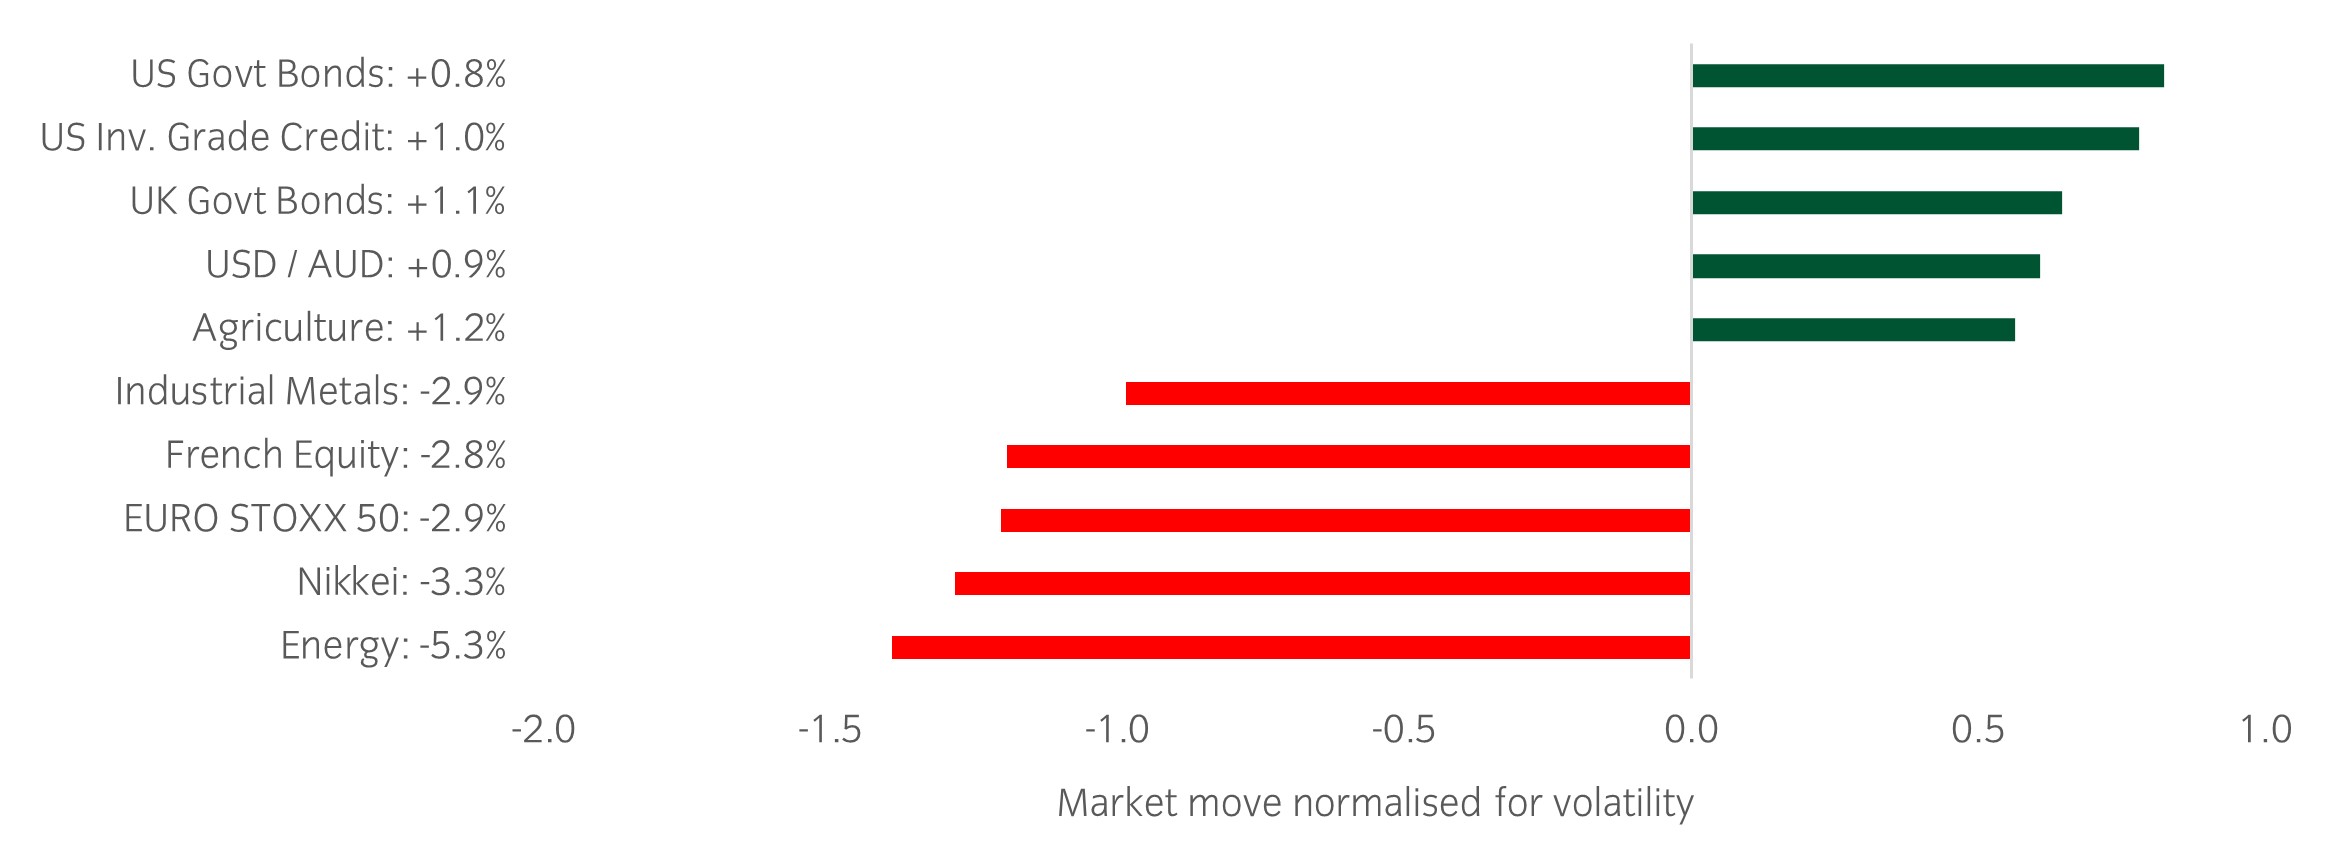
Source: Bloomberg and Insight as at 6 September 2024. The price movement of each asset is shown next to its name. The data used by the bar chart divides the price movement by the annualised historical volatility of each asset.
Over the past week, several things caught our eye:
- A very busy week on the macro front was topped off by a small downside miss in non-farm payrolls. The US economy added 142k jobs in August, below consensus expectations of 165k. Additionally, downward revisions to previous months were 86k. Weighed against an unchanged unemployment rate (4.2%), the likelihood of the Fed cutting rates by 25 or 50 basis points at its September meeting remains in the balance.
- Divergences continued between manufacturing and services PMIs as the manufacturing sector continues to underperform. ISM manufacturing has now stayed in contractionary territory (i.e. below 50) for 21 of the last 22 months.
- Rotation continued within equity markets with highly cyclical names suffering most. Defensive names have now outperformed their cyclical counterparts by 20% since mid-July.
Winners & losers: Equities underperformed over the week alongside cyclically sensitive commodities such as energy and industrial metals. Duration was the outperformer on the prospect of more central bank rate cuts.
Asset allocation observation
Underwhelming manufacturing and labour data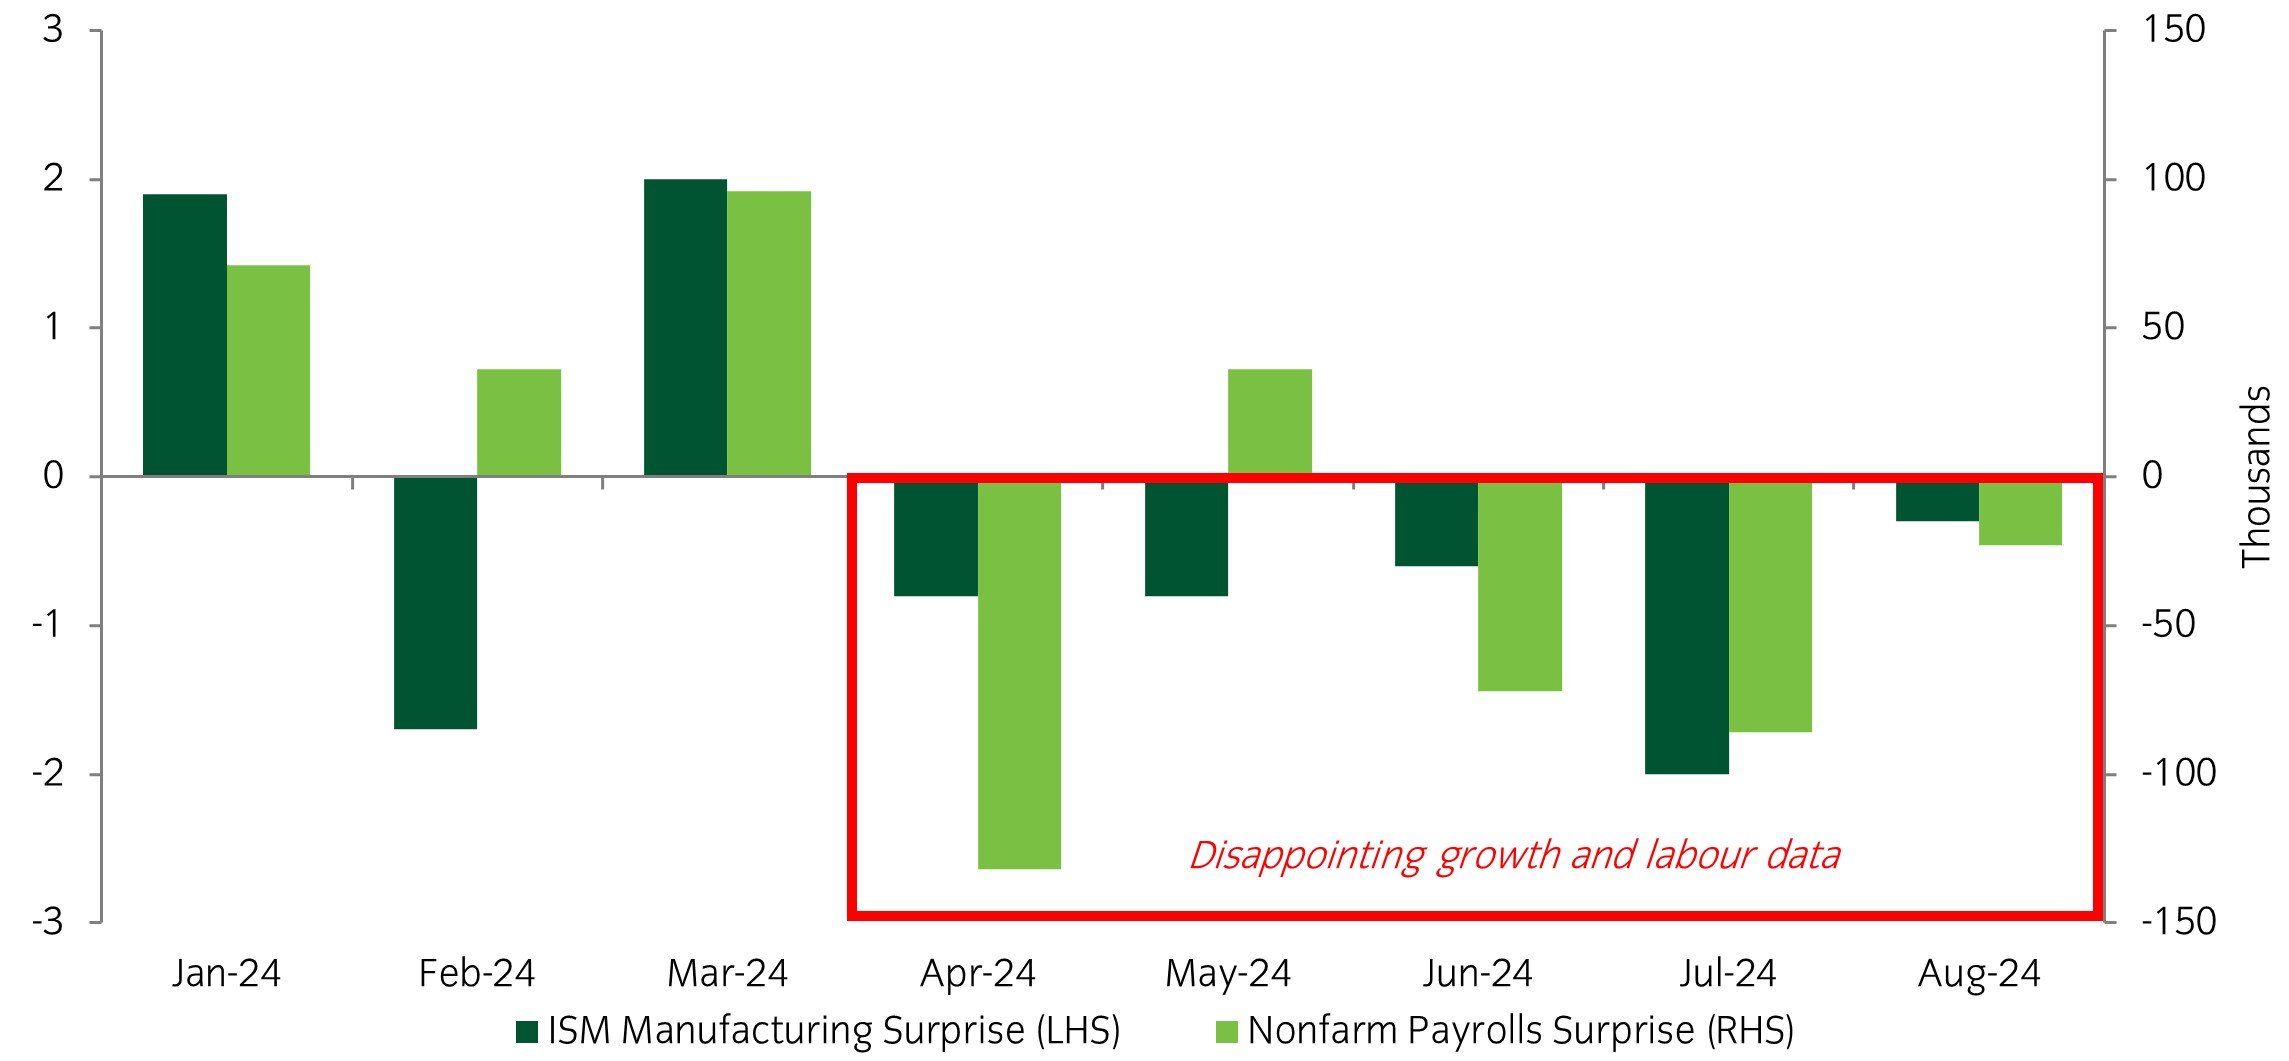
Source: Insight and Bloomberg as at 6 September 2024.
- A series of consecutively underwhelming growth related data has put markets on edge. The ISM manufacturing PMI has come in below consensus for five consecutive prints while nonfarm payrolls has also had a clear negative skew. While GDP growth remains resilient, 2nd quarter GDP growth was recently revised up to 3%, cracks are certainly appearing within the economy.
- Given the risks to growth have become more balanced over recent months, we have trimmed some exposure in equities and edged up duration.